You are viewing a plain text version of this content. The canonical link for it is here.
Posted to commits@iotdb.apache.org by ha...@apache.org on 2023/03/01 10:02:31 UTC
[iotdb] branch rel/0.13 updated: docs(site): image move to site (#9185)
This is an automated email from the ASF dual-hosted git repository.
haonan pushed a commit to branch rel/0.13
in repository https://gitbox.apache.org/repos/asf/iotdb.git
The following commit(s) were added to refs/heads/rel/0.13 by this push:
new 75eaadccdf docs(site): image move to site (#9185)
75eaadccdf is described below
commit 75eaadccdf07cce9dde5f3057ee997734131b76e
Author: CritasWang <cr...@outlook.com>
AuthorDate: Wed Mar 1 18:02:23 2023 +0800
docs(site): image move to site (#9185)
---
docs/UserGuide/API/Programming-Go-Native-API.md | 2 +-
docs/UserGuide/API/Programming-JDBC.md | 2 +-
docs/UserGuide/API/Programming-MQTT.md | 4 +-
docs/UserGuide/Cluster/Cluster-Setup.md | 2 +-
.../Data-Concept/Data-Model-and-Terminology.md | 4 +-
docs/UserGuide/Data-Concept/Schema-Template.md | 6 +--
docs/UserGuide/Data-Concept/Time-Partition.md | 2 +-
.../DBeaver.md | 16 +++----
.../Flink-IoTDB.md} | 0
.../Flink-TsFile.md} | 0
.../Grafana-Connector.md} | 6 +--
.../Grafana-Plugin.md} | 24 +++++-----
.../Hive-TsFile.md} | 0
.../MapReduce-TsFile.md} | 0
.../NiFi-IoTDB.md | 0
.../Spark-IoTDB.md} | 2 +-
.../Spark-TsFile.md} | 4 +-
.../Writing-Data-on-HDFS.md} | 2 +-
.../Zeppelin-IoTDB.md | 8 ++--
docs/UserGuide/IoTDB-Introduction/Architecture.md | 2 +-
docs/UserGuide/IoTDB-Introduction/Scenario.md | 14 +++---
docs/UserGuide/Maintenance-Tools/JMX-Tool.md | 4 +-
docs/UserGuide/Maintenance-Tools/Log-Tool.md | 6 +--
docs/UserGuide/Maintenance-Tools/Metric-Tool.md | 10 ++--
.../Operate-Metadata/Auto-Create-MetaData.md | 2 +-
docs/UserGuide/Operate-Metadata/Timeseries.md | 4 +-
docs/UserGuide/Process-Data/Alerting.md | 2 +-
docs/UserGuide/Process-Data/Triggers.md | 2 +-
.../Process-Data/UDF-User-Defined-Function.md | 2 +-
docs/UserGuide/Query-Data/Aggregate-Query.md | 2 +-
docs/UserGuide/Query-Data/Fill-Null-Value.md | 4 --
docs/UserGuide/Query-Data/Select-Expression.md | 8 ++--
.../UserGuide/QuickStart/Command-Line-Interface.md | 28 +++++------
docs/UserGuide/QuickStart/QuickStart.md | 2 +-
docs/UserGuide/Reference/Config-Manual.md | 2 +-
docs/UserGuide/Reference/SQL-Reference.md | 4 +-
docs/UserGuide/Reference/TSDB-Comparison.md | 16 +++----
docs/UserGuide/UserGuideReadme.md | 5 +-
docs/zh/UserGuide/API/InfluxDB-Protocol.md | 10 ++--
docs/zh/UserGuide/API/Programming-Go-Native-API.md | 55 ----------------------
docs/zh/UserGuide/API/Programming-JDBC.md | 2 +-
docs/zh/UserGuide/API/Programming-MQTT.md | 4 +-
docs/zh/UserGuide/Cluster/Cluster-Setup.md | 2 +-
.../Data-Concept/Data-Model-and-Terminology.md | 4 +-
docs/zh/UserGuide/Data-Concept/Schema-Template.md | 6 +--
docs/zh/UserGuide/Data-Concept/Time-Partition.md | 2 +-
.../DBeaver.md | 16 +++----
.../Flink-IoTDB.md} | 0
.../Flink-TsFile.md} | 0
.../Grafana-Connector.md} | 6 +--
.../Grafana-Plugin.md} | 24 +++++-----
.../Hive-TsFile.md} | 0
.../MapReduce-TsFile.md} | 0
.../NiFi-IoTDB.md | 0
.../Spark TsFile.md | 0
.../Spark-IoTDB.md} | 0
.../Writing-Data-on-HDFS.md} | 2 +-
.../Zeppelin-IoTDB.md | 8 ++--
.../UserGuide/IoTDB-Introduction/Architecture.md | 2 +-
docs/zh/UserGuide/IoTDB-Introduction/Scenario.md | 14 +++---
docs/zh/UserGuide/Maintenance-Tools/JMX-Tool.md | 4 +-
docs/zh/UserGuide/Maintenance-Tools/Log-Tool.md | 6 +--
docs/zh/UserGuide/Maintenance-Tools/Metric-Tool.md | 10 ++--
.../Operate-Metadata/Auto-Create-MetaData.md | 2 +-
docs/zh/UserGuide/Operate-Metadata/Timeseries.md | 4 +-
docs/zh/UserGuide/Process-Data/Alerting.md | 2 +-
docs/zh/UserGuide/Process-Data/Continuous-Query.md | 2 +-
docs/zh/UserGuide/Process-Data/Triggers.md | 2 +-
.../Process-Data/UDF-User-Defined-Function.md | 2 +-
docs/zh/UserGuide/Query-Data/Aggregate-Query.md | 2 +-
docs/zh/UserGuide/Query-Data/Select-Expression.md | 10 ++--
.../UserGuide/QuickStart/Command-Line-Interface.md | 26 +++++-----
docs/zh/UserGuide/QuickStart/QuickStart.md | 2 +-
docs/zh/UserGuide/Reference/SQL-Reference.md | 4 +-
docs/zh/UserGuide/Reference/TSDB-Comparison.md | 14 +++---
docs/zh/UserGuide/UserGuideReadme.md | 7 ++-
76 files changed, 199 insertions(+), 260 deletions(-)
diff --git a/docs/UserGuide/API/Programming-Go-Native-API.md b/docs/UserGuide/API/Programming-Go-Native-API.md
index dca270713b..22946caaa7 100644
--- a/docs/UserGuide/API/Programming-Go-Native-API.md
+++ b/docs/UserGuide/API/Programming-Go-Native-API.md
@@ -109,4 +109,4 @@ if err == nil {
} else {
log.Println(err)
}
-```
\ No newline at end of file
+```
diff --git a/docs/UserGuide/API/Programming-JDBC.md b/docs/UserGuide/API/Programming-JDBC.md
index 592243f931..2caca3cba7 100644
--- a/docs/UserGuide/API/Programming-JDBC.md
+++ b/docs/UserGuide/API/Programming-JDBC.md
@@ -64,7 +64,7 @@ It requires including the packages containing the JDBC classes needed for databa
**NOTE: For faster insertion, the insertTablet() in Session is recommended.**
-```Java
+```java
import java.sql.*;
import org.apache.iotdb.jdbc.IoTDBSQLException;
diff --git a/docs/UserGuide/API/Programming-MQTT.md b/docs/UserGuide/API/Programming-MQTT.md
index 19934f8aae..4858d68e57 100644
--- a/docs/UserGuide/API/Programming-MQTT.md
+++ b/docs/UserGuide/API/Programming-MQTT.md
@@ -27,7 +27,7 @@ It is useful for connections with remote locations where a small code footprint
IoTDB supports the MQTT v3.1(an OASIS Standard) protocol.
IoTDB server includes a built-in MQTT service that allows remote devices send messages into IoTDB server directly.
-<img style="width:100%; max-width:800px; max-height:600px; margin-left:auto; margin-right:auto; display:block;" src="https://user-images.githubusercontent.com/6711230/78357432-0c71cf80-75e4-11ea-98aa-c43a54d469ce.png">
+<img style="width:100%; max-width:800px; max-height:600px; margin-left:auto; margin-right:auto; display:block;" src="/img/github/78357432-0c71cf80-75e4-11ea-98aa-c43a54d469ce.png">
### Built-in MQTT Service
@@ -55,7 +55,7 @@ or
}
```
-<img style="width:100%; max-width:800px; max-height:600px; margin-left:auto; margin-right:auto; display:block;" src="https://user-images.githubusercontent.com/6711230/78357469-1bf11880-75e4-11ea-978f-a53996667a0d.png">
+<img style="width:100%; max-width:800px; max-height:600px; margin-left:auto; margin-right:auto; display:block;" src="/img/github/78357469-1bf11880-75e4-11ea-978f-a53996667a0d.png">
### MQTT Configurations
The IoTDB MQTT service load configurations from `${IOTDB_HOME}/${IOTDB_CONF}/iotdb-engine.properties` by default.
diff --git a/docs/UserGuide/Cluster/Cluster-Setup.md b/docs/UserGuide/Cluster/Cluster-Setup.md
index 67382a1cc9..b437f6af2c 100644
--- a/docs/UserGuide/Cluster/Cluster-Setup.md
+++ b/docs/UserGuide/Cluster/Cluster-Setup.md
@@ -38,7 +38,7 @@ IoTDB provides you three installation methods, you can refer to the following su
- Installation from source code. If you need to modify the code yourself, you can use this method.
- Installation from binary files. Download the binary files from the official website.
-- Using Docker:The path to the dockerfile is https://github.com/apache/iotdb/blob/master/docker/src/main
+- Using Docker:The path to the dockerfile is [github](https://github.com/apache/iotdb/blob/master/docker/src/main)
### Build from source
diff --git a/docs/UserGuide/Data-Concept/Data-Model-and-Terminology.md b/docs/UserGuide/Data-Concept/Data-Model-and-Terminology.md
index c6a6f6b73d..c5c159756a 100644
--- a/docs/UserGuide/Data-Concept/Data-Model-and-Terminology.md
+++ b/docs/UserGuide/Data-Concept/Data-Model-and-Terminology.md
@@ -25,7 +25,7 @@ A wind power IoT scenario is taken as an example to illustrate how to creat a co
According to the enterprise organization structure and equipment entity hierarchy, it is expressed as an attribute hierarchy structure, as shown below. The hierarchical from top to bottom is: power group layer - power plant layer - entity layer - measurement layer. ROOT is the root node, and each node of measurement layer is a leaf node. In the process of using IoTDB, the attributes on the path from ROOT node is directly connected to each leaf node with ".", thus forming the name of a ti [...]
-<center><img style="width:100%; max-width:800px; max-height:600px; margin-left:auto; margin-right:auto; display:block;" src="https://user-images.githubusercontent.com/19167280/122668849-b1c69280-d1ec-11eb-83cb-3b73c40bdf72.png"></center>
+<center><img style="width:100%; max-width:800px; max-height:600px; margin-left:auto; margin-right:auto; display:block;" src="/img/github/122668849-b1c69280-d1ec-11eb-83cb-3b73c40bdf72.png"></center>
Here are the basic concepts of the model involved in IoTDB.
@@ -139,7 +139,7 @@ When querying, you can query each timeseries separately.
When inserting data, it is allowed to insert null value in the aligned timeseries.
-<img style="width:100%; max-width:800px; max-height:600px; margin-left:auto; margin-right:auto; display:block;" src="https://user-images.githubusercontent.com/19167280/114125919-f4850800-9929-11eb-8211-81d4c04af1ec.png">
+<img style="width:100%; max-width:800px; max-height:600px; margin-left:auto; margin-right:auto; display:block;" src="/img/github/114125919-f4850800-9929-11eb-8211-81d4c04af1ec.png">
In the following chapters of data definition language, data operation language and Java Native Interface, various operations related to aligned timeseries will be introduced one by one.
diff --git a/docs/UserGuide/Data-Concept/Schema-Template.md b/docs/UserGuide/Data-Concept/Schema-Template.md
index fac5f8592f..d489cbeaa1 100644
--- a/docs/UserGuide/Data-Concept/Schema-Template.md
+++ b/docs/UserGuide/Data-Concept/Schema-Template.md
@@ -29,7 +29,7 @@ In order to enable different entities of the same type to share metadata, reduce
The following picture illustrates the data model of petrol vehicle scenario. The velocity, fuel amount, acceleration, and angular velocity of each petrol vehicle spread over cities will be collected. Obviously, the measurements of single petrol vehicle are the same as those of another.
-<img style="width:100%; max-width:800px; max-height:600px; margin-left:auto; margin-right:auto; display:block;" src="https://github.com/apache/iotdb-bin-resources/blob/main/docs/UserGuide/Data%20Concept/Measurement%20Template/example_without_template.png?raw=true" alt="example without template">
+<img style="width:100%; max-width:800px; max-height:600px; margin-left:auto; margin-right:auto; display:block;" src="/img/UserGuide/Data-Concept/Measurement-Template/example_without_template.png?raw=true" alt="example without template">
## Concepts
@@ -47,7 +47,7 @@ In the following chapters of data definition language, data operation language a
After applying schema template, the following picture illustrates the new data model of petrol vehicle scenario. All petrol vehicles share the schemas defined in template. There are no redundancy storage of measurement schemas.
-<img style="width:100%; max-width:800px; max-height:600px; margin-left:auto; margin-right:auto; display:block;" src="https://github.com/apache/iotdb-bin-resources/blob/main/docs/UserGuide/Data%20Concept/Measurement%20Template/example_with_template.png?raw=true" alt="example with template">
+<img style="width:100%; max-width:800px; max-height:600px; margin-left:auto; margin-right:auto; display:block;" src="/img/UserGuide/Data-Concept/Measurement-Template/example_with_template.png?raw=true" alt="example with template">
### Lifetime of Schema Template
@@ -62,7 +62,7 @@ The term about lifetime of schema template may help you utilize it in a better w
It should be complemented that the distinction between SET and ACTIVATE is meant to serve an ubiquitous scenario where massive nodes with a common ancestor may need to apply the template. Under this circumstance, it is more feasible to SET the template on the common ancestor rather than all those descendant. For those who needs to apply the template, ACTIVATE is a more appropriate arrangement.
-<img style="width:100%; max-width:800px; margin-left:auto; margin-right:auto; display:block;" src="https://github.com/apache/iotdb-bin-resources/blob/main/docs/UserGuide/Data%20Concept/Measurement%20Template/example_template_lifetime.png?raw=true" alt="example with template">
+<img style="width:100%; max-width:800px; margin-left:auto; margin-right:auto; display:block;" src="/img/UserGuide/Data-Concept/Measurement-Template/example_template_lifetime.png?raw=true" alt="example with template">
## Usage
diff --git a/docs/UserGuide/Data-Concept/Time-Partition.md b/docs/UserGuide/Data-Concept/Time-Partition.md
index b77f3c6abe..337dc51c30 100644
--- a/docs/UserGuide/Data-Concept/Time-Partition.md
+++ b/docs/UserGuide/Data-Concept/Time-Partition.md
@@ -49,7 +49,7 @@ Notice: Currently, it's not recommend to open this function. If open, please cal
Enable time partition and set partition_interval to 86400 (one day), then the data distribution is shown as the following figure:
-<img style="width:100%; max-width:800px; max-height:600px; margin-left:auto; margin-right:auto; display:block;" src="https://github.com/apache/iotdb-bin-resources/blob/main/docs/UserGuide/Data%20Concept/Time-Partition/time_partition_example.png?raw=true" alt="time partition example">
+<img style="width:100%; max-width:800px; max-height:600px; margin-left:auto; margin-right:auto; display:block;" src="/img/UserGuide/Data-Concept/Time-Partition/time_partition_example.png?raw=true" alt="time partition example">
* Insert one datapoint with timestamp 0, calculate 0/86400 = 0, then this datapoint will be stored in TsFile under folder 0
diff --git a/docs/UserGuide/Ecosystem Integration/DBeaver.md b/docs/UserGuide/Ecosystem-Integration/DBeaver.md
similarity index 60%
rename from docs/UserGuide/Ecosystem Integration/DBeaver.md
rename to docs/UserGuide/Ecosystem-Integration/DBeaver.md
index 25159978d5..c222105717 100644
--- a/docs/UserGuide/Ecosystem Integration/DBeaver.md
+++ b/docs/UserGuide/Ecosystem-Integration/DBeaver.md
@@ -45,11 +45,11 @@ DBeaver is a SQL client software application and a database administration tool.
2. Start DBeaver
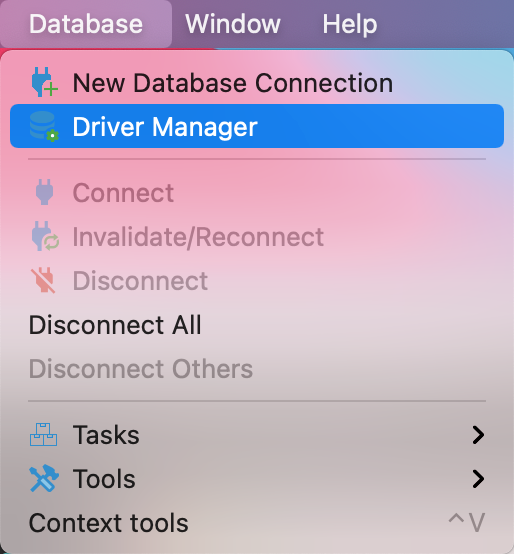
3. Open Driver Manager
- 
+ 
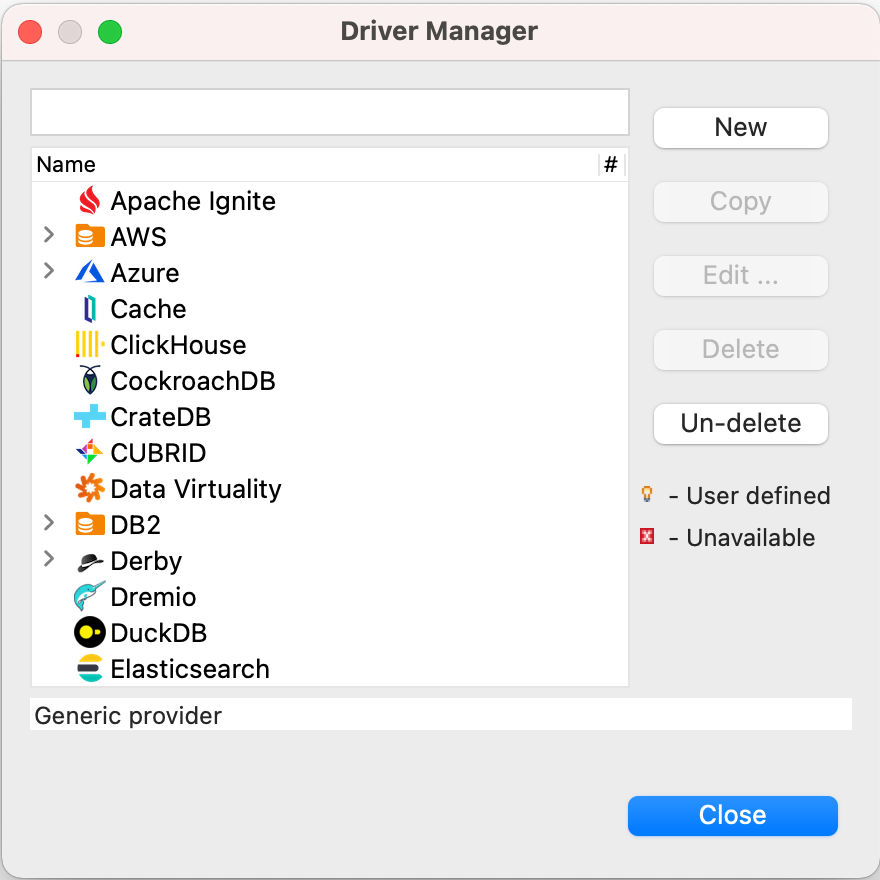
4. Create a new driver type for IoTDB
- 
+ 
5. Download [Sources](https://iotdb.apache.org/Download/),unzip it and compile jdbc driver by the following command
@@ -58,15 +58,15 @@ DBeaver is a SQL client software application and a database administration tool.
```
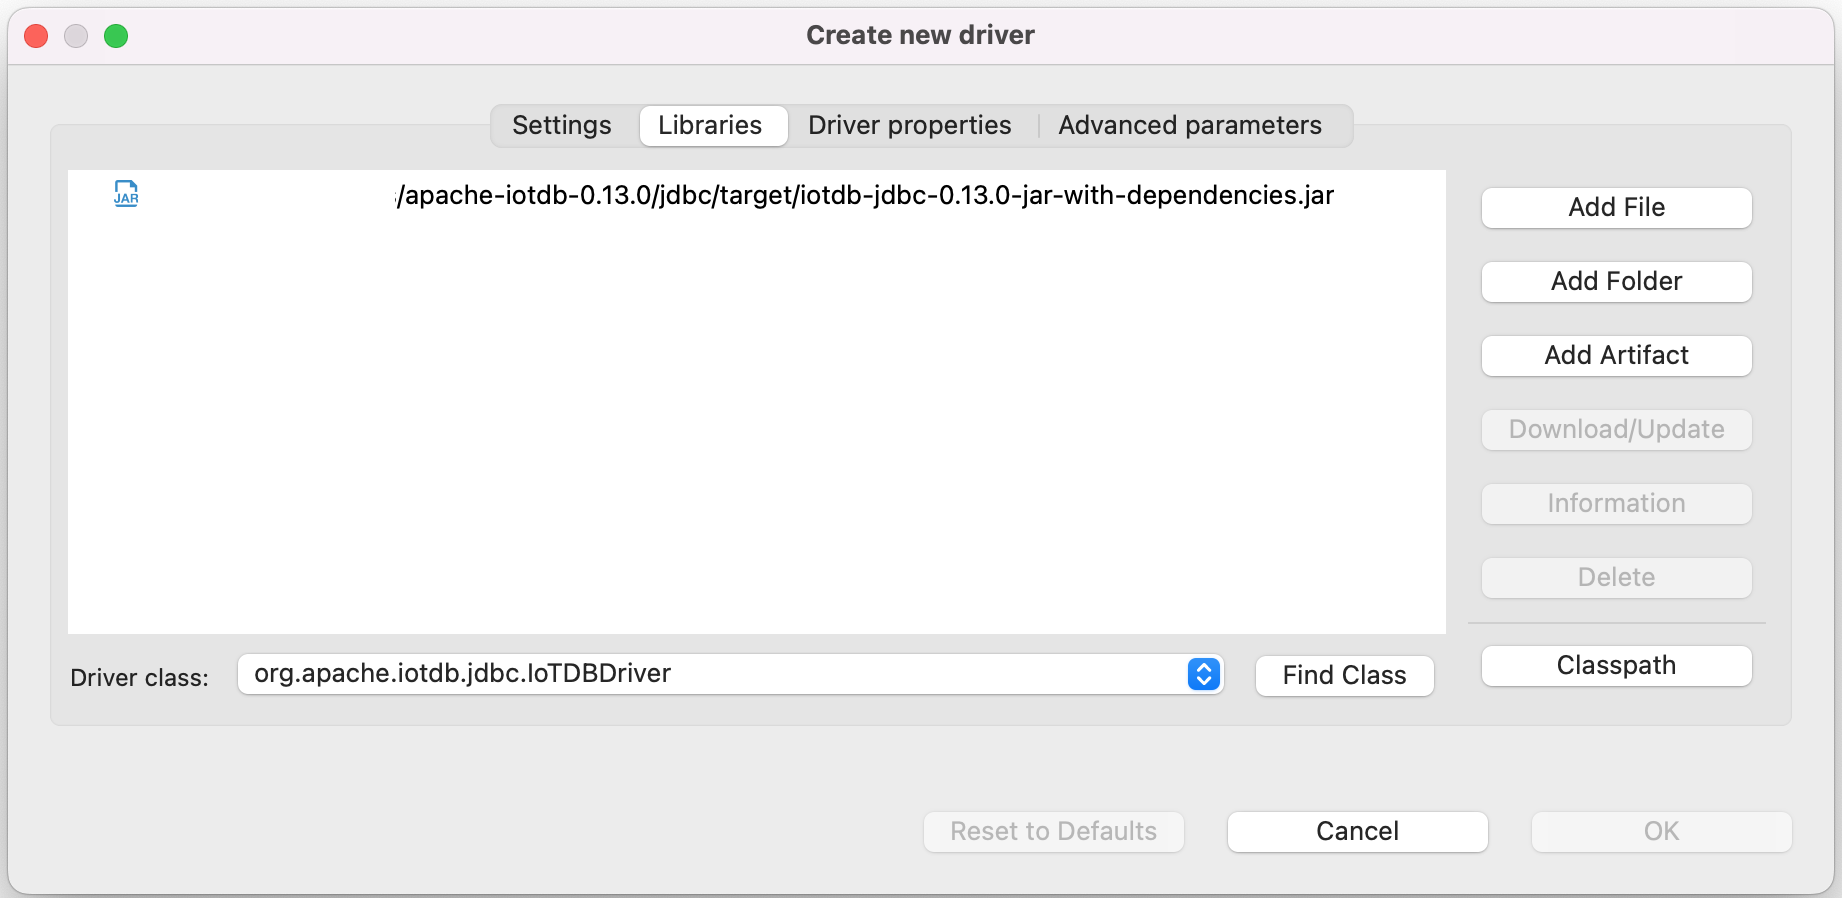
6. Find and add a lib named `apache-iotdb-jdbc-{version}-jar-with-dependencies.jar`, which should be under `jdbc/target/`, then select `Find Class`.
- 
+ 
8. Edit the driver Settings
- 
+ 
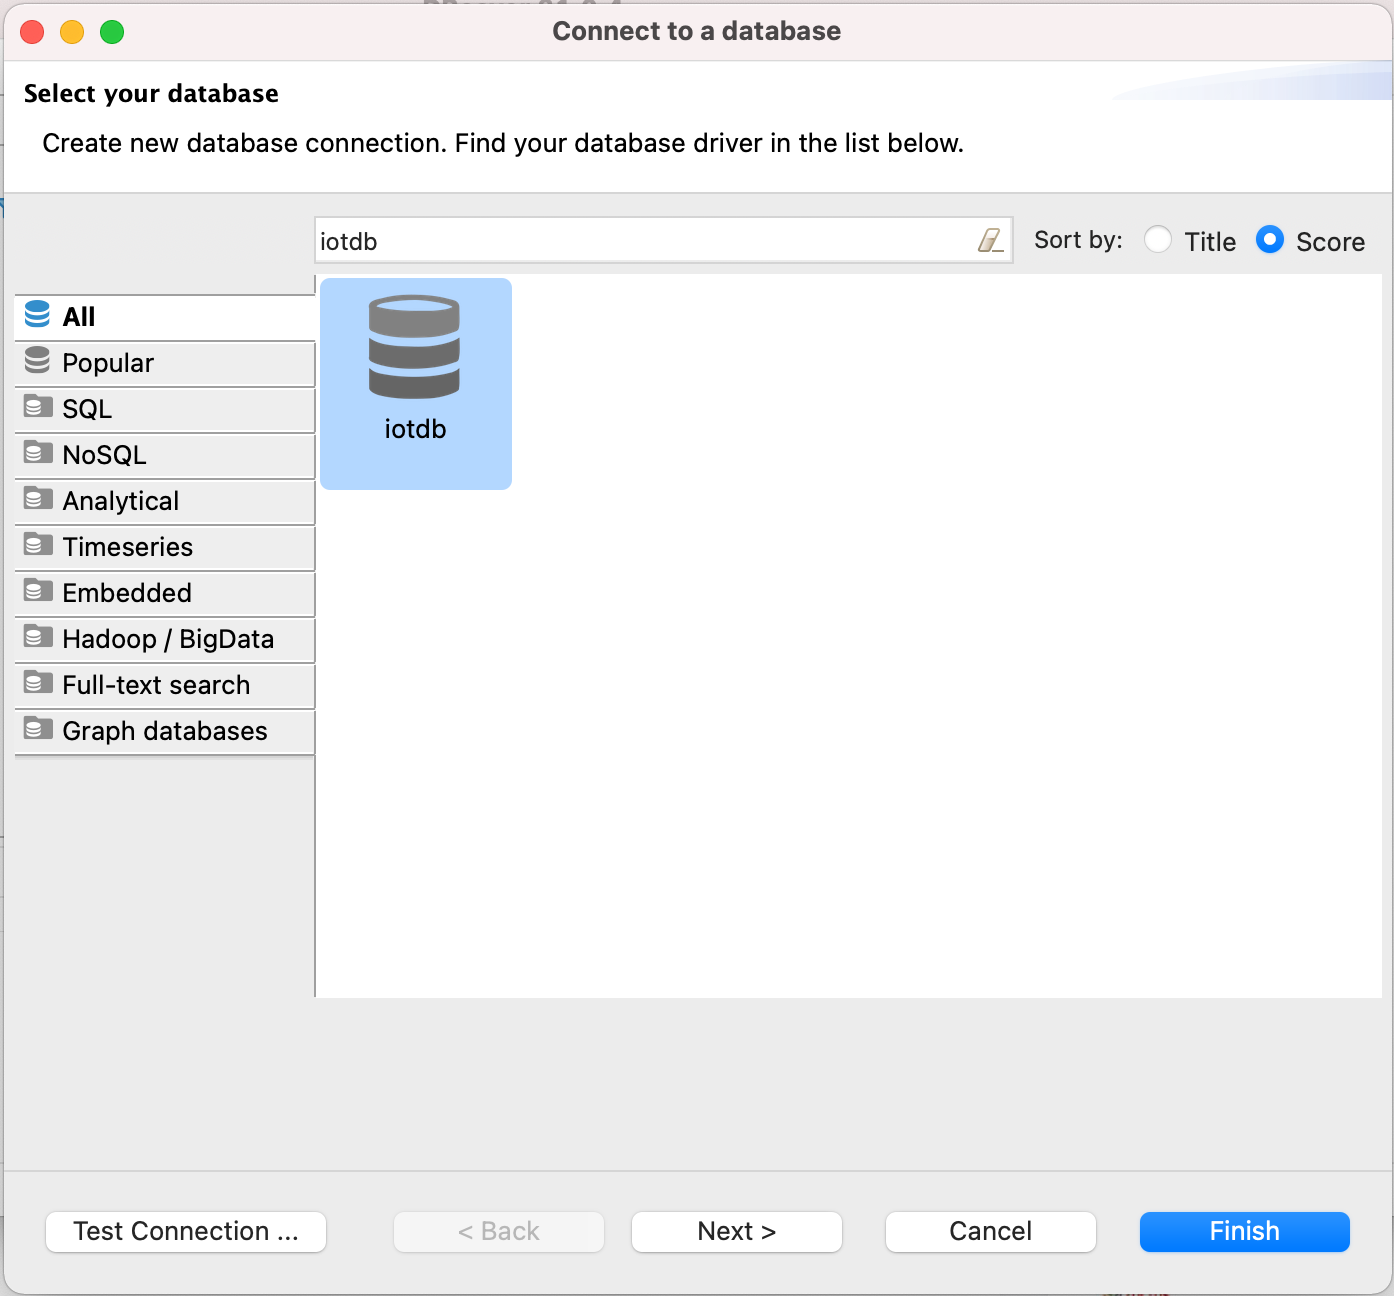
9. Open New DataBase Connection and select iotdb
- 
+ 
10. Edit JDBC Connection Settings
@@ -75,12 +75,12 @@ DBeaver is a SQL client software application and a database administration tool.
Username: root
Password: root
```
- 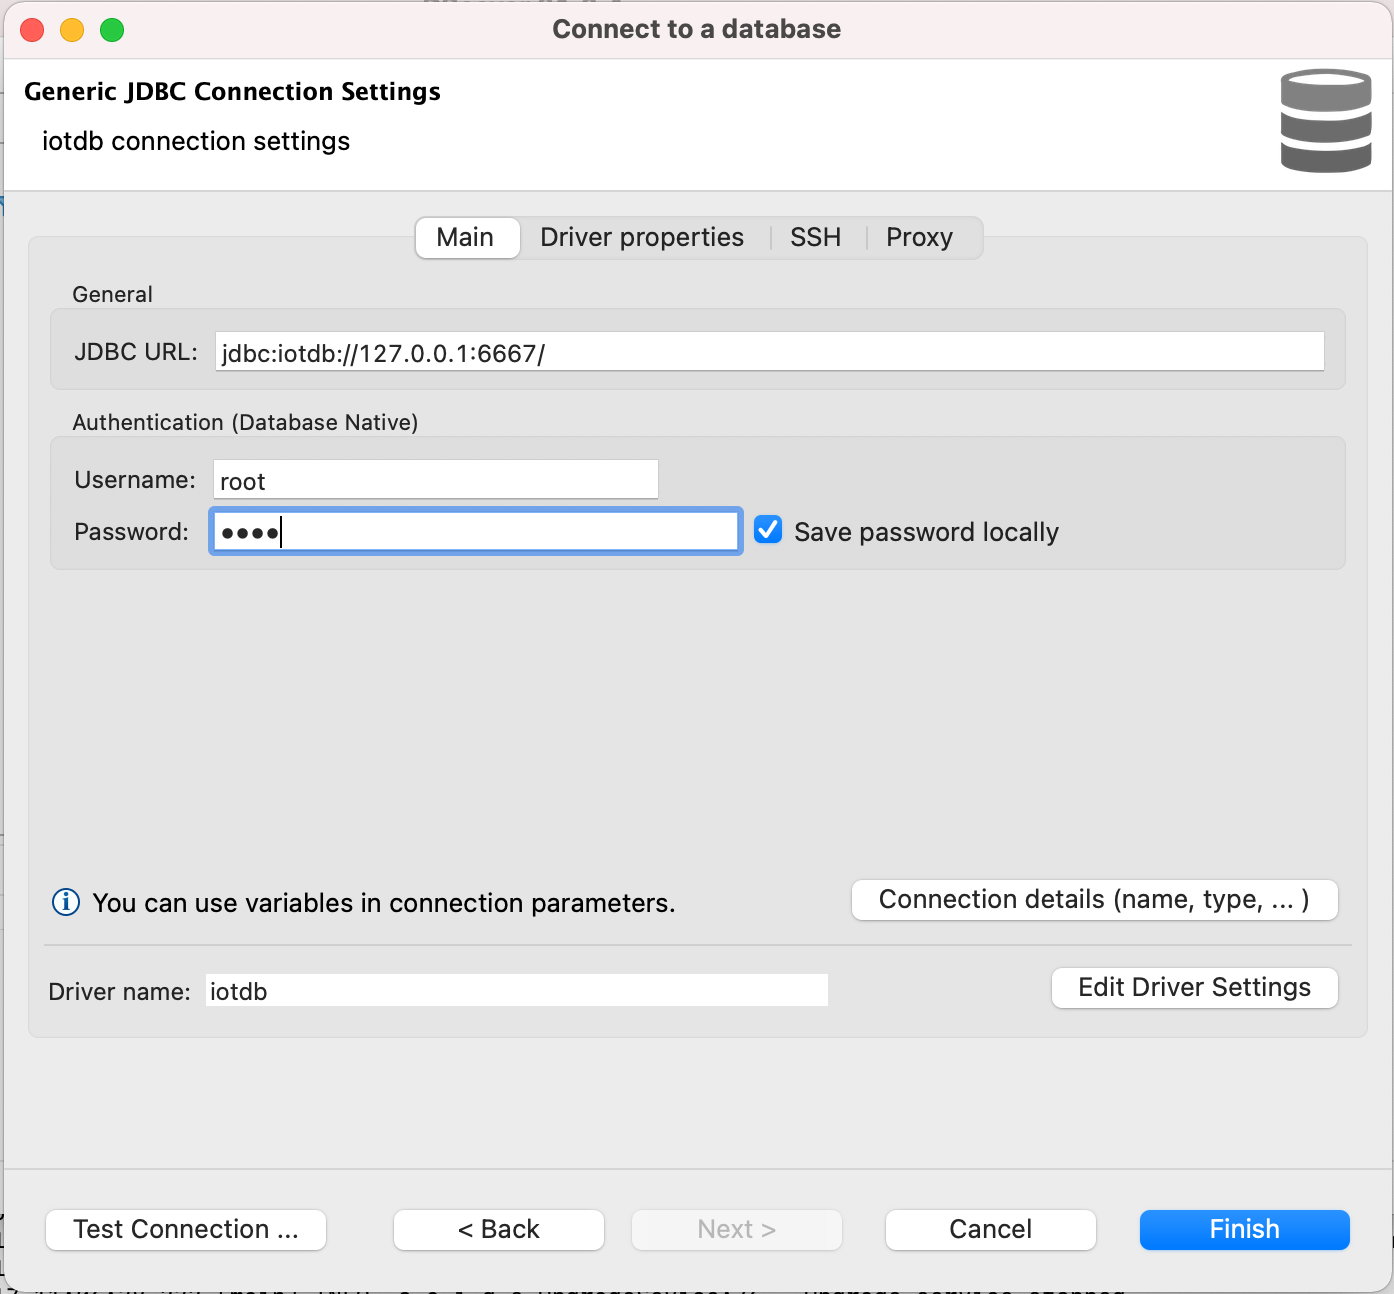
+ 
11. Test Connection
- 
+ 
12. Enjoy IoTDB with DBeaver
- 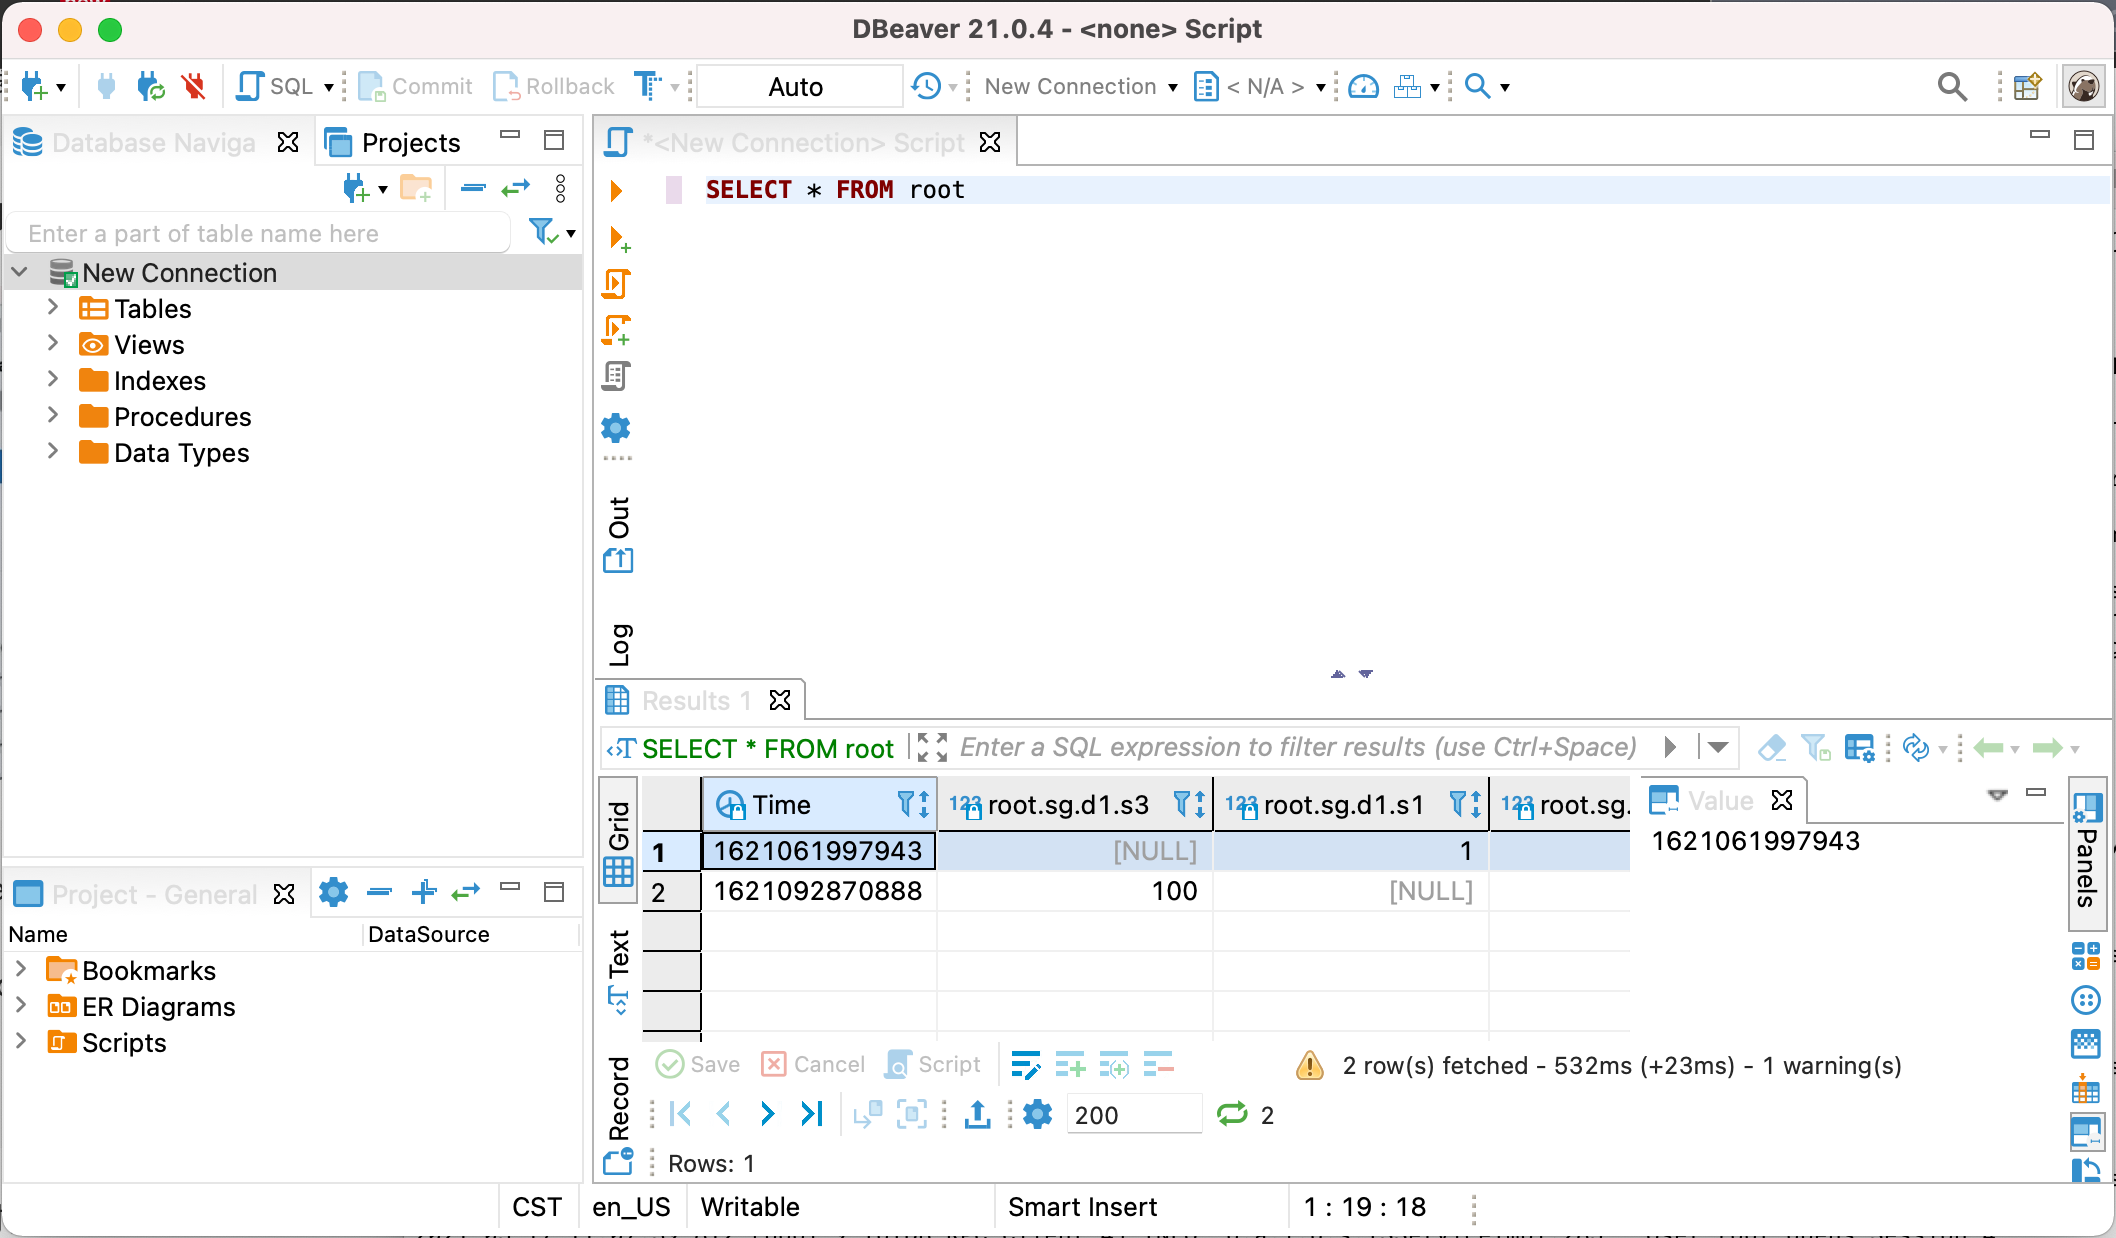
+ 
diff --git a/docs/UserGuide/Ecosystem Integration/Flink IoTDB.md b/docs/UserGuide/Ecosystem-Integration/Flink-IoTDB.md
similarity index 100%
rename from docs/UserGuide/Ecosystem Integration/Flink IoTDB.md
rename to docs/UserGuide/Ecosystem-Integration/Flink-IoTDB.md
diff --git a/docs/UserGuide/Ecosystem Integration/Flink TsFile.md b/docs/UserGuide/Ecosystem-Integration/Flink-TsFile.md
similarity index 100%
rename from docs/UserGuide/Ecosystem Integration/Flink TsFile.md
rename to docs/UserGuide/Ecosystem-Integration/Flink-TsFile.md
diff --git a/docs/UserGuide/Ecosystem Integration/Grafana Connector.md b/docs/UserGuide/Ecosystem-Integration/Grafana-Connector.md
similarity index 93%
rename from docs/UserGuide/Ecosystem Integration/Grafana Connector.md
rename to docs/UserGuide/Ecosystem-Integration/Grafana-Connector.md
index 1c9b12227b..72d26ca401 100644
--- a/docs/UserGuide/Ecosystem Integration/Grafana Connector.md
+++ b/docs/UserGuide/Ecosystem-Integration/Grafana-Connector.md
@@ -128,15 +128,15 @@ Username and password are both "admin" by default.
Select `Data Sources` and then `Add data source`, select `SimpleJson` in `Type` and `URL` is http://localhost:8888.
After that, make sure IoTDB has been started, click "Save & Test", and "Data Source is working" will be shown to indicate successful configuration.
-<img style="width:100%; max-width:800px; max-height:600px; margin-left:auto; margin-right:auto; display:block;" src="https://user-images.githubusercontent.com/13203019/51664777-2766ae00-1ff5-11e9-9d2f-7489f8ccbfc2.png">
+<img style="width:100%; max-width:800px; max-height:600px; margin-left:auto; margin-right:auto; display:block;" src="/img/github/51664777-2766ae00-1ff5-11e9-9d2f-7489f8ccbfc2.png">
-<img style="width:100%; max-width:800px; max-height:600px; margin-left:auto; margin-right:auto; display:block;" src="https://user-images.githubusercontent.com/13203019/51664842-554bf280-1ff5-11e9-97d2-54eebe0b2ca1.png">
+<img style="width:100%; max-width:800px; max-height:600px; margin-left:auto; margin-right:auto; display:block;" src="/img/github/51664842-554bf280-1ff5-11e9-97d2-54eebe0b2ca1.png">
#### Design in dashboard
Add diagrams in dashboard and customize your query. See http://docs.grafana.org/guides/getting_started/
-<img style="width:100%; max-width:800px; max-height:600px; margin-left:auto; margin-right:auto; display:block;" src="https://user-images.githubusercontent.com/13203019/51664878-6e54a380-1ff5-11e9-9718-4d0e24627fa8.png">
+<img style="width:100%; max-width:800px; max-height:600px; margin-left:auto; margin-right:auto; display:block;" src="/img/github/51664878-6e54a380-1ff5-11e9-9718-4d0e24627fa8.png">
### config grafana
diff --git a/docs/UserGuide/Ecosystem Integration/Grafana Plugin.md b/docs/UserGuide/Ecosystem-Integration/Grafana-Plugin.md
similarity index 78%
rename from docs/UserGuide/Ecosystem Integration/Grafana Plugin.md
rename to docs/UserGuide/Ecosystem-Integration/Grafana-Plugin.md
index 998ab76b57..2aa7405195 100644
--- a/docs/UserGuide/Ecosystem Integration/Grafana Plugin.md
+++ b/docs/UserGuide/Ecosystem-Integration/Grafana-Plugin.md
@@ -67,7 +67,7 @@ yarn build
If compiling successful, you can see the `dist` directory , which contains the compiled Grafana-Plugin:
-<img style="width:100%; max-width:333px; max-height:545px; margin-left:auto; margin-right:auto; display:block;" src="https://github.com/apache/iotdb-bin-resources/blob/main/docs/UserGuide/Ecosystem%20Integration/Grafana-plugin/grafana-plugin-build.png?raw=true">
+<img style="width:100%; max-width:333px; max-height:545px; margin-left:auto; margin-right:auto; display:block;" src="/img/UserGuide/Ecosystem-Integration/Grafana-plugin/grafana-plugin-build.png?raw=true">
##### Compile Method 2
@@ -81,7 +81,7 @@ Execute following command in the IoTDB root directory:
If compiling successful, you can see that the `distribution/target` directory contains the compiled Grafana-Plugin:
-<img style="width:100%; max-width:333px; max-height:545px; margin-left:auto; margin-right:auto; display:block;" src="https://github.com/apache/iotdb-bin-resources/blob/main/docs/UserGuide/Ecosystem%20Integration/Grafana-plugin/distribution.png?raw=true">
+<img style="width:100%; max-width:333px; max-height:545px; margin-left:auto; margin-right:auto; display:block;" src="/img/UserGuide/Ecosystem-Integration/Grafana-plugin/distribution.png?raw=true">
#### Install Grafana-Plugin
@@ -156,9 +156,9 @@ Grafana displays data in a web page dashboard. Please open your browser and visi
Click the `Settings` icon on the left, select the `Data Source` option, and then click `Add data source`.
-<img style="width:100%; max-width:800px; max-height:600px; margin-left:auto; margin-right:auto; display:block;" src="https://github.com/apache/iotdb-bin-resources/blob/main/docs/UserGuide/Ecosystem%20Integration/Grafana-plugin/datasource_1.png?raw=true">
+<img style="width:100%; max-width:800px; max-height:600px; margin-left:auto; margin-right:auto; display:block;" src="/img/UserGuide/Ecosystem-Integration/Grafana-plugin/datasource_1.png?raw=true">
-<img style="width:100%; max-width:800px; max-height:600px; margin-left:auto; margin-right:auto; display:block;" src="https://github.com/apache/iotdb-bin-resources/blob/main/docs/UserGuide/Ecosystem%20Integration/Grafana-plugin/datasource_2.png?raw=true">
+<img style="width:100%; max-width:800px; max-height:600px; margin-left:auto; margin-right:auto; display:block;" src="/img/UserGuide/Ecosystem-Integration/Grafana-plugin/datasource_2.png?raw=true">
Select the `Apache IoTDB` data source.
@@ -169,24 +169,24 @@ Select the `Apache IoTDB` data source.
Click `Save & Test`, and `Success` will appear.
-<img style="width:100%; max-width:800px; max-height:600px; margin-left:auto; margin-right:auto; display:block;" src="https://github.com/apache/iotdb-bin-resources/blob/main/docs/UserGuide/Ecosystem%20Integration/Grafana-plugin/datasource_3.png?raw=true">
+<img style="width:100%; max-width:800px; max-height:600px; margin-left:auto; margin-right:auto; display:block;" src="/img/UserGuide/Ecosystem-Integration/Grafana-plugin/datasource_3.png?raw=true">
#### Create a new Panel
Click the `Dashboards` icon on the left, and select `Manage` option.
-<img style="width:100%; max-width:800px; max-height:600px; margin-left:auto; margin-right:auto; display:block;" src="https://github.com/apache/iotdb-bin-resources/blob/main/docs/UserGuide/Ecosystem%20Integration/Grafana-plugin/manage.png?raw=true">
+<img style="width:100%; max-width:800px; max-height:600px; margin-left:auto; margin-right:auto; display:block;" src="/img/UserGuide/Ecosystem-Integration/Grafana-plugin/manage.png?raw=true">
Click the `New Dashboard` icon on the top right, and select `Add an empty panel` option.
-<img style="width:100%; max-width:800px; max-height:600px; margin-left:auto; margin-right:auto; display:block;" src="https://github.com/apache/iotdb-bin-resources/blob/main/docs/UserGuide/Ecosystem%20Integration/Grafana-plugin/add%20empty%20panel.png?raw=true">
+<img style="width:100%; max-width:800px; max-height:600px; margin-left:auto; margin-right:auto; display:block;" src="/img/UserGuide/Ecosystem-Integration/Grafana-plugin/add-empty-panel.png?raw=true">
Enter content in the SELECT, FROM , WHERE and CONTROL input box, where the WHERE and CONTROL input boxes are optional.
If a query involves multiple expressions, we can click `+` on the right side of the SELECT input box to add expressions in the SELECT clause, or click `+` on the right side of the FROM input box to add a path prefix:
-<img style="width:100%; max-width:800px; max-height:600px; margin-left:auto; margin-right:auto; display:block;" src="https://github.com/apache/iotdb-bin-resources/blob/main/docs/UserGuide/Ecosystem%20Integration/Grafana-plugin/grafana_input.png?raw=true">
+<img style="width:100%; max-width:800px; max-height:600px; margin-left:auto; margin-right:auto; display:block;" src="/img/UserGuide/Ecosystem-Integration/Grafana-plugin/grafana_input.png?raw=true">
SELECT input box: contents can be the time series suffix, function, udf, arithmetic expression, or nested expressions. You can also use the as clause to rename the result.
@@ -222,19 +222,19 @@ This plugin supports Grafana's variables and templates (https://grafana.com/docs
After creating a new Panel, click the Settings button in the upper right corner:
-<img style="width:100%; max-width:800px; max-height:600px; margin-left:auto; margin-right:auto; display:block;" src="https://github.com/apache/iotdb-bin-resources/blob/main/docs/UserGuide/Ecosystem%20Integration/Grafana-plugin/setconf.png?raw=true">
+<img style="width:100%; max-width:800px; max-height:600px; margin-left:auto; margin-right:auto; display:block;" src="/img/UserGuide/Ecosystem-Integration/Grafana-plugin/setconf.png?raw=true">
Select `Variables`, click `Add variable`:
-<img style="width:100%; max-width:800px; max-height:600px; margin-left:auto; margin-right:auto; display:block;" src="https://github.com/apache/iotdb-bin-resources/blob/main/docs/UserGuide/Ecosystem%20Integration/Grafana-plugin/addvaribles.png?raw=true">
+<img style="width:100%; max-width:800px; max-height:600px; margin-left:auto; margin-right:auto; display:block;" src="/img/UserGuide/Ecosystem-Integration/Grafana-plugin/addvaribles.png?raw=true">
Enter `Name`, `Label`, and `Query`, and then click the `Update` button:
-<img style="width:100%; max-width:800px; max-height:600px; margin-left:auto; margin-right:auto; display:block;" src="https://github.com/apache/iotdb-bin-resources/blob/main/docs/UserGuide/Ecosystem%20Integration/Grafana-plugin/variblesinput.png?raw=true">
+<img style="width:100%; max-width:800px; max-height:600px; margin-left:auto; margin-right:auto; display:block;" src="/img/UserGuide/Ecosystem-Integration/Grafana-plugin/variblesinput.png?raw=true">
Apply Variables, enter the variable in the `grafana panel` and click the `save` button:
-<img style="width:100%; max-width:800px; max-height:600px; margin-left:auto; margin-right:auto; display:block;" src="https://github.com/apache/iotdb-bin-resources/blob/main/docs/UserGuide/Ecosystem%20Integration/Grafana-plugin/applyvariables.png?raw=true">
+<img style="width:100%; max-width:800px; max-height:600px; margin-left:auto; margin-right:auto; display:block;" src="/img/UserGuide/Ecosystem-Integration/Grafana-plugin/applyvariables.png?raw=true">
### More Details about Grafana
diff --git a/docs/UserGuide/Ecosystem Integration/Hive TsFile.md b/docs/UserGuide/Ecosystem-Integration/Hive-TsFile.md
similarity index 100%
rename from docs/UserGuide/Ecosystem Integration/Hive TsFile.md
rename to docs/UserGuide/Ecosystem-Integration/Hive-TsFile.md
diff --git a/docs/UserGuide/Ecosystem Integration/MapReduce TsFile.md b/docs/UserGuide/Ecosystem-Integration/MapReduce-TsFile.md
similarity index 100%
rename from docs/UserGuide/Ecosystem Integration/MapReduce TsFile.md
rename to docs/UserGuide/Ecosystem-Integration/MapReduce-TsFile.md
diff --git a/docs/UserGuide/Ecosystem Integration/NiFi-IoTDB.md b/docs/UserGuide/Ecosystem-Integration/NiFi-IoTDB.md
similarity index 100%
rename from docs/UserGuide/Ecosystem Integration/NiFi-IoTDB.md
rename to docs/UserGuide/Ecosystem-Integration/NiFi-IoTDB.md
diff --git a/docs/UserGuide/Ecosystem Integration/Spark IoTDB.md b/docs/UserGuide/Ecosystem-Integration/Spark-IoTDB.md
similarity index 98%
rename from docs/UserGuide/Ecosystem Integration/Spark IoTDB.md
rename to docs/UserGuide/Ecosystem-Integration/Spark-IoTDB.md
index 35d6926a0c..c878559c40 100644
--- a/docs/UserGuide/Ecosystem Integration/Spark IoTDB.md
+++ b/docs/UserGuide/Ecosystem-Integration/Spark-IoTDB.md
@@ -93,7 +93,7 @@ Take the following TsFile structure as an example: There are three Measurements
The existing data in the TsFile is as follows:
-<img width="517" alt="SI " src="https://user-images.githubusercontent.com/69114052/98197835-99a64980-1f62-11eb-84af-8301b8a6aad5.png">
+<img width="517" alt="SI " src="/img/github/98197835-99a64980-1f62-11eb-84af-8301b8a6aad5.png">
The wide(default) table form is as follows:
diff --git a/docs/UserGuide/Ecosystem Integration/Spark TsFile.md b/docs/UserGuide/Ecosystem-Integration/Spark-TsFile.md
similarity index 98%
rename from docs/UserGuide/Ecosystem Integration/Spark TsFile.md
rename to docs/UserGuide/Ecosystem-Integration/Spark-TsFile.md
index 9c6cfe7e7c..f5232314f5 100644
--- a/docs/UserGuide/Ecosystem Integration/Spark TsFile.md
+++ b/docs/UserGuide/Ecosystem-Integration/Spark-TsFile.md
@@ -94,7 +94,7 @@ The way to display TsFile is dependent on the schema. Take the following TsFile
The existing data in the TsFile are:
-<img width="519" alt="ST 1" src="https://user-images.githubusercontent.com/69114052/98197920-be9abc80-1f62-11eb-9efb-027f0590031c.png">
+<img width="519" alt="ST 1" src="/img/github/98197920-be9abc80-1f62-11eb-9efb-027f0590031c.png">
The corresponding SparkSQL table is:
@@ -239,7 +239,7 @@ The way to display TsFile is related to TsFile Schema. Take the following TsFile
The existing data in the file are:
-<img width="817" alt="ST 2" src="https://user-images.githubusercontent.com/69114052/98197948-cf4b3280-1f62-11eb-9c8c-c97d1adf032c.png">
+<img width="817" alt="ST 2" src="/img/github/98197948-cf4b3280-1f62-11eb-9c8c-c97d1adf032c.png">
A set of time-series data
diff --git a/docs/UserGuide/Ecosystem Integration/Writing Data on HDFS.md b/docs/UserGuide/Ecosystem-Integration/Writing-Data-on-HDFS.md
similarity index 97%
rename from docs/UserGuide/Ecosystem Integration/Writing Data on HDFS.md
rename to docs/UserGuide/Ecosystem-Integration/Writing-Data-on-HDFS.md
index 57f371d79b..33d9f18fab 100644
--- a/docs/UserGuide/Ecosystem Integration/Writing Data on HDFS.md
+++ b/docs/UserGuide/Ecosystem-Integration/Writing-Data-on-HDFS.md
@@ -29,7 +29,7 @@ Currently, TsFiles(including both TsFile and related data files) are supported t
When you config to store TSFile on HDFS, your data files will be in distributed storage. The system architecture is as below:
-<img style="width:100%; max-width:700px; max-height:600px; margin-left:auto; margin-right:auto; display:block;" src="https://user-images.githubusercontent.com/19167280/66922722-35180400-f05a-11e9-8ff0-7dd51716e4a8.png">
+<img style="width:100%; max-width:700px; max-height:600px; margin-left:auto; margin-right:auto; display:block;" src="/img/github/66922722-35180400-f05a-11e9-8ff0-7dd51716e4a8.png">
#### Config and usage
diff --git a/docs/UserGuide/Ecosystem Integration/Zeppelin-IoTDB.md b/docs/UserGuide/Ecosystem-Integration/Zeppelin-IoTDB.md
similarity index 92%
rename from docs/UserGuide/Ecosystem Integration/Zeppelin-IoTDB.md
rename to docs/UserGuide/Ecosystem-Integration/Zeppelin-IoTDB.md
index 4d2b278687..e2fd675d17 100644
--- a/docs/UserGuide/Ecosystem Integration/Zeppelin-IoTDB.md
+++ b/docs/UserGuide/Ecosystem-Integration/Zeppelin-IoTDB.md
@@ -25,7 +25,7 @@
Zeppelin is a web-based notebook that enables interactive data analytics. You can connect to data sources and perform interactive operations with SQL, Scala, etc. The operations can be saved as documents, just like Jupyter. Zeppelin has already supported many data sources, including Spark, ElasticSearch, Cassandra, and InfluxDB. Now, we have enabled Zeppelin to operate IoTDB via SQL.
-
+
@@ -113,7 +113,7 @@ In the interpreter page:
Now you are ready to use your interpreter.
-
+
We provide some simple SQL to show the use of Zeppelin-IoTDB interpreter:
@@ -147,7 +147,7 @@ We provide some simple SQL to show the use of Zeppelin-IoTDB interpreter:
The screenshot is as follows:
-
+
You can also design more fantasy documents referring to [[1]](https://zeppelin.apache.org/docs/0.9.0/usage/display_system/basic.html) and others.
@@ -159,7 +159,7 @@ The above demo notebook can be found at `$IoTDB_HOME/zeppelin-interpreter/Zeppe
You can configure the connection parameters in http://127.0.0.1:8080/#/interpreter :
-
+
The parameters you can configure are as follows:
diff --git a/docs/UserGuide/IoTDB-Introduction/Architecture.md b/docs/UserGuide/IoTDB-Introduction/Architecture.md
index 27eef200d9..e6757a8c43 100644
--- a/docs/UserGuide/IoTDB-Introduction/Architecture.md
+++ b/docs/UserGuide/IoTDB-Introduction/Architecture.md
@@ -25,7 +25,7 @@ Besides IoTDB engine, we also developed several components to provide better IoT
IoTDB suite can provide a series of functions in the real situation such as data collection, data writing, data storage, data query, data visualization and data analysis. Figure 1.1 shows the overall application architecture brought by all the components of the IoTDB suite.
-<img style="width:100%; max-width:800px; max-height:600px; margin-left:auto; margin-right:auto; display:block;" src="https://user-images.githubusercontent.com/25913899/67943956-39c1e800-fc16-11e9-8da2-a662f8246816.png">
+<img style="width:100%; max-width:800px; max-height:600px; margin-left:auto; margin-right:auto; display:block;" src="/img/github/67943956-39c1e800-fc16-11e9-8da2-a662f8246816.png">
As shown in Figure 1.1, users can use JDBC to import timeseries data collected by sensor on the device to local/remote IoTDB. These timeseries data may be system state data (such as server load and CPU memory, etc.), message queue data, timeseries data from applications, or other timeseries data in the database. Users can also write the data directly to the TsFile (local or on HDFS).
diff --git a/docs/UserGuide/IoTDB-Introduction/Scenario.md b/docs/UserGuide/IoTDB-Introduction/Scenario.md
index 3709ba5b5a..c3e0e72ec0 100644
--- a/docs/UserGuide/IoTDB-Introduction/Scenario.md
+++ b/docs/UserGuide/IoTDB-Introduction/Scenario.md
@@ -31,11 +31,11 @@ In order to improve the quality of the printing, it is necessary for the company
At this point, the data can be stored using TsFile component, TsFileSync tool, and Hadoop/Spark integration component in the IoTDB suite.That is, each time a new chip is printed, a data is written on the SPI device using the SDK, which ultimately forms a TsFile. Through the TsFileSync tool, the generated TsFile will be synchronized to the data center according to certain rules (such as daily) and analyzed by data analysts tools.
-<img style="width:100%; max-width:800px; max-height:600px; margin-left:auto; margin-right:auto; display:block;" src="https://user-images.githubusercontent.com/13203019/51579014-695ef980-1efa-11e9-8cbc-e9e7ee4fa0d8.png">
+<img style="width:100%; max-width:800px; max-height:600px; margin-left:auto; margin-right:auto; display:block;" src="/img/github/51579014-695ef980-1efa-11e9-8cbc-e9e7ee4fa0d8.png">
In this scenario, only TsFile and TsFileSync are required to be deployed on a PC, and a Hadoop/Spark cluster is required. Figure below shows the architecture at this time.
-<img style="width:100%; max-width:800px; max-height:600px; margin-left:auto; margin-right:auto; display:block;" src="https://user-images.githubusercontent.com/25913899/81768490-bf034f00-950d-11ea-9b56-fef3edca0958.png">
+<img style="width:100%; max-width:800px; max-height:600px; margin-left:auto; margin-right:auto; display:block;" src="/img/github/81768490-bf034f00-950d-11ea-9b56-fef3edca0958.png">
* Scenario 2
@@ -43,11 +43,11 @@ A company has several wind turbines which are installed hundreds of sensors on e
In order to ensure the normal operation of the turbines and timely monitoring and analysis of the turbines, the company needs to collect these sensor data, perform partial calculation and analysis in the turbines working environment, and upload the original data collected to the data center.
-<img style="width:100%; max-width:800px; max-height:600px; margin-left:auto; margin-right:auto; display:block;" src="https://user-images.githubusercontent.com/13203019/51579033-7ed42380-1efa-11e9-889f-fb4180291a9e.png">
+<img style="width:100%; max-width:800px; max-height:600px; margin-left:auto; margin-right:auto; display:block;" src="/img/github/51579033-7ed42380-1efa-11e9-889f-fb4180291a9e.png">
In this situation, IoTDB, TsFileSync tools, and Hadoop/Spark integration components in the IoTDB suite can be used. A PC needs to be deployed with IoTDB and TsFileSync tools installed to support reading and writing data, local computing and analysis, and uploading data to the data center. In addition, Hadoop/Spark clusters need to be deployed for data storage and analysis on the data center side. Figure below shows the architecture at this time.
-<img style="width:100%; max-width:800px; max-height:600px; margin-left:auto; margin-right:auto; display:block;" src="https://user-images.githubusercontent.com/13203019/51579064-8f849980-1efa-11e9-8cd6-a7339cd0540f.jpg">
+<img style="width:100%; max-width:800px; max-height:600px; margin-left:auto; margin-right:auto; display:block;" src="/img/github/51579064-8f849980-1efa-11e9-8cd6-a7339cd0540f.jpg">
* Scenario 3
@@ -57,11 +57,11 @@ A variety of sensors are installed on each robotic device to monitor the robot's
In order to ensure that the data of the robot can be monitored and analyzed in time, the company needs to collect the information of these robot sensors, send them to the server that can connect to the external network, and then upload the original data information to the data center for complex calculation and analysis.
-<img style="width:100%; max-width:800px; max-height:600px; margin-left:auto; margin-right:auto; display:block;" src="https://user-images.githubusercontent.com/13203019/51579080-96aba780-1efa-11e9-87ac-940c45b19dd7.jpg">
+<img style="width:100%; max-width:800px; max-height:600px; margin-left:auto; margin-right:auto; display:block;" src="/img/github/51579080-96aba780-1efa-11e9-87ac-940c45b19dd7.jpg">
At this point, IoTDB, IoTDB-Client tools, TsFileSync tools, and Hadoop/Spark integration components in the IoTDB suite can be used. IoTDB-Client tool is installed on the robot and each of them is connected to the LAN of the factory. When sensors generate real-time data, the data will be uploaded to the server in the factory. The IoTDB server and TsFileSync is installed on the server connected to the external network. Once triggered, the data on the server will be upload to the data cente [...]
-<img style="width:100%; max-width:800px; max-height:600px; margin-left:auto; margin-right:auto; display:block;" src="https://user-images.githubusercontent.com/25913899/81768477-b874d780-950d-11ea-80ca-8807b9bd0970.png">
+<img style="width:100%; max-width:800px; max-height:600px; margin-left:auto; margin-right:auto; display:block;" src="/img/github/81768477-b874d780-950d-11ea-80ca-8807b9bd0970.png">
* Scenario 4
@@ -73,4 +73,4 @@ At this point, IoTDB, IoTDB-Client, and Hadoop/Spark integration components in t
In addition, Hadoop/Spark clusters need to be deployed for data storage and analysis on the data center side. As shown in Figure below.
-<img style="width:100%; max-width:800px; max-height:600px; margin-left:auto; margin-right:auto; display:block;" src="https://user-images.githubusercontent.com/13203019/51579095-a4f9c380-1efa-11e9-9f95-17165ec55568.jpg">
+<img style="width:100%; max-width:800px; max-height:600px; margin-left:auto; margin-right:auto; display:block;" src="/img/github/51579095-a4f9c380-1efa-11e9-9f95-17165ec55568.jpg">
diff --git a/docs/UserGuide/Maintenance-Tools/JMX-Tool.md b/docs/UserGuide/Maintenance-Tools/JMX-Tool.md
index 3851b4badc..171bb222f5 100644
--- a/docs/UserGuide/Maintenance-Tools/JMX-Tool.md
+++ b/docs/UserGuide/Maintenance-Tools/JMX-Tool.md
@@ -48,12 +48,12 @@ Step 4: Use jvisualvm
1. Make sure jdk 8 is installed. For versions later than jdk 8, you need to [download visualvm](https://visualvm.github.io/download.html)
2. Open jvisualvm
3. Right-click at the left navigation area -> Add JMX connection
-<img style="width:100%; max-width:300px; max-height:600px; margin-left:auto; margin-right:auto; display:block;" src="https://user-images.githubusercontent.com/19167280/81464569-725e0200-91f5-11ea-9ff9-49745f4c9ef2.png">
+<img style="width:100%; max-width:300px; max-height:600px; margin-left:auto; margin-right:auto; display:block;" src="/img/github/81464569-725e0200-91f5-11ea-9ff9-49745f4c9ef2.png">
4. Fill in information and log in as below. Remember to check "Do not require SSL connection".
An example is:
Connection:192.168.130.15:31999
Username:iotdb
Password:passw!d
-<img style="width:100%; max-width:300px; max-height:600px; margin-left:auto; margin-right:auto; display:block;" src="https://user-images.githubusercontent.com/19167280/81464639-ed271d00-91f5-11ea-91a0-b4fe9cb8204e.png">
+<img style="width:100%; max-width:300px; max-height:600px; margin-left:auto; margin-right:auto; display:block;" src="/img/github/81464639-ed271d00-91f5-11ea-91a0-b4fe9cb8204e.png">
diff --git a/docs/UserGuide/Maintenance-Tools/Log-Tool.md b/docs/UserGuide/Maintenance-Tools/Log-Tool.md
index 5395274642..0ce3c0512e 100644
--- a/docs/UserGuide/Maintenance-Tools/Log-Tool.md
+++ b/docs/UserGuide/Maintenance-Tools/Log-Tool.md
@@ -35,14 +35,14 @@ Here we use JConsole to connect with JMX.
Start the JConsole, establish a new JMX connection with the IoTDB Server (you can select the local process or input the IP and PORT for remote connection, the default operation port of the IoTDB JMX service is 31999). Fig 4.1 shows the connection GUI of JConsole.
-<img style="width:100%; max-width:800px; max-height:600px; margin-left:auto; margin-right:auto; display:block;" src="https://user-images.githubusercontent.com/13203019/51577195-f94d7500-1ef3-11e9-999a-b4f67055d80e.png">
+<img style="width:100%; max-width:800px; max-height:600px; margin-left:auto; margin-right:auto; display:block;" src="/img/github/51577195-f94d7500-1ef3-11e9-999a-b4f67055d80e.png">
After connected, click `MBean` and find `ch.qos.logback.classic.default.ch.qos.logback.classic.jmx.JMXConfigurator`(As shown in fig 4.2).
-<img style="width:100%; max-width:800px; max-height:600px; margin-left:auto; margin-right:auto; display:block;" src="https://user-images.githubusercontent.com/13203019/51577204-fe122900-1ef3-11e9-9e89-2eb1d46e24b8.png">
+<img style="width:100%; max-width:800px; max-height:600px; margin-left:auto; margin-right:auto; display:block;" src="/img/github/51577204-fe122900-1ef3-11e9-9e89-2eb1d46e24b8.png">
In the JMXConfigurator Window, there are 6 operations provided, as shown in fig 4.3. You can use these interfaces to perform operation.
-<img style="width:100%; max-width:800px; max-height:600px; margin-left:auto; margin-right:auto; display:block;" src="https://user-images.githubusercontent.com/13203019/51577216-09fdeb00-1ef4-11e9-9005-542ad7d9e9e0.png">
+<img style="width:100%; max-width:800px; max-height:600px; margin-left:auto; margin-right:auto; display:block;" src="/img/github/51577216-09fdeb00-1ef4-11e9-9005-542ad7d9e9e0.png">
#### Interface Instruction
diff --git a/docs/UserGuide/Maintenance-Tools/Metric-Tool.md b/docs/UserGuide/Maintenance-Tools/Metric-Tool.md
index 8699be63e0..3a8b857d7d 100644
--- a/docs/UserGuide/Maintenance-Tools/Metric-Tool.md
+++ b/docs/UserGuide/Maintenance-Tools/Metric-Tool.md
@@ -319,7 +319,7 @@ As above descriptions,IoTDB provides metrics data in standard Prometheus forma
The following picture describes the relationships among IoTDB, Prometheus and Grafana
-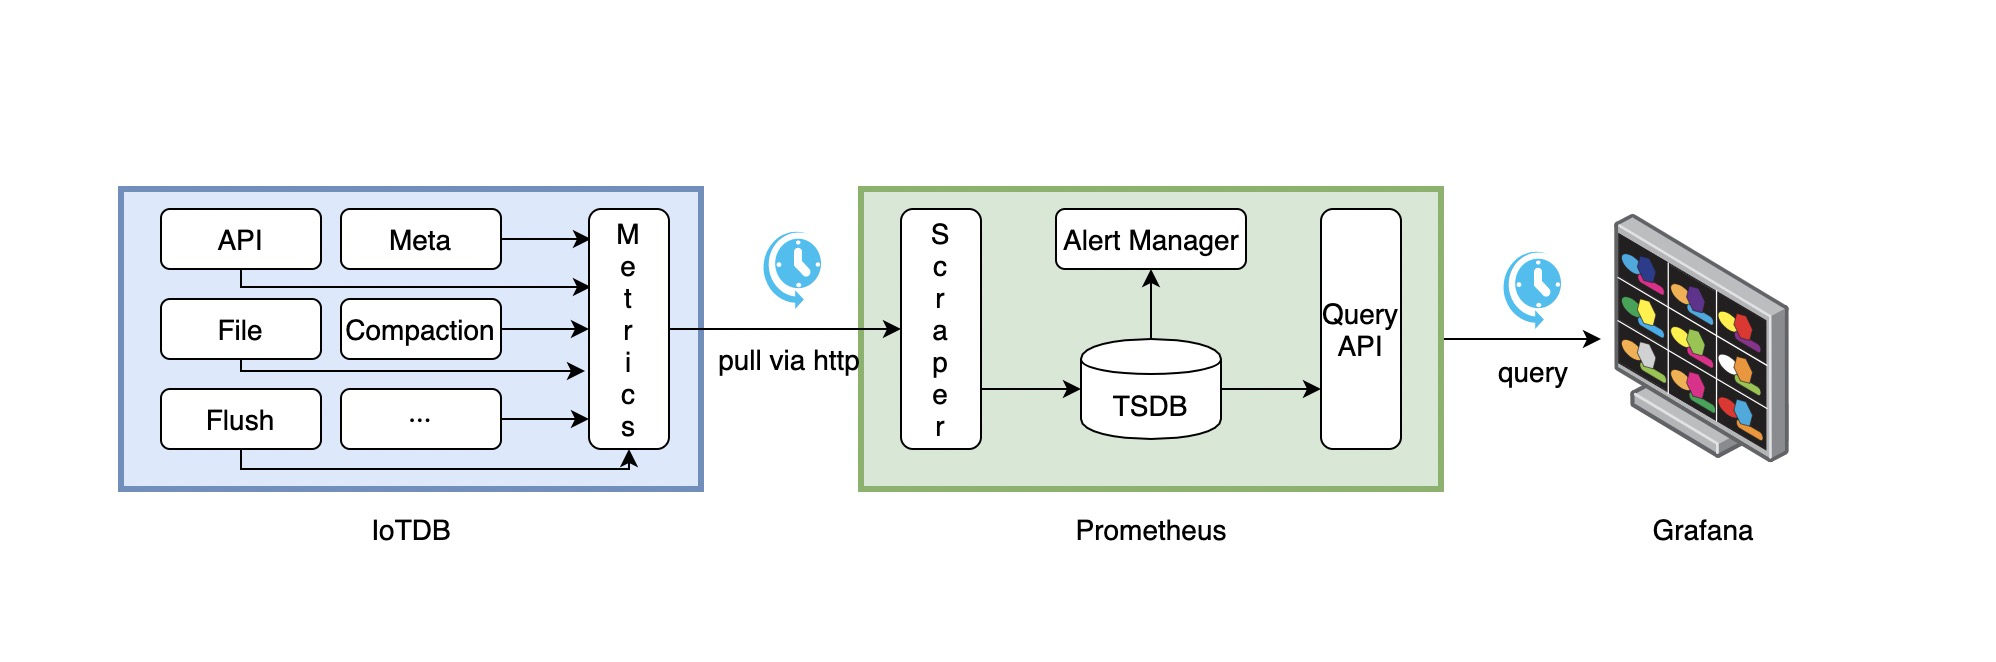
+
1. Along with running, IoTDB will collect its metrics continuously.
2. Prometheus scrapes metrics from IoTDB at a constant interval (can be configured).
@@ -357,7 +357,7 @@ The following documents may help you have a good journey with Prometheus and Gra
### 1.4.3. Apache IoTDB Dashboard
We provide the Apache IoTDB Dashboard, and the rendering shown in Grafana is as follows:
-
+
How to get Apache IoTDB Dashboard:
@@ -375,7 +375,7 @@ By using JConsole tool and connecting with JMX you are provided with some system
This section describes how to use the JConsole ```Mbean```tab of jconsole to monitor some system configurations of IoTDB, the statistics of writing, and so on. After connecting to JMX, you can find the "MBean" of "org.apache.iotdb.service", as shown in the figure below.
-<img style="width:100%; max-width:800px; max-height:600px; margin-left:auto; margin-right:auto; display:block;" src="https://user-images.githubusercontent.com/46039728/149951720-707f1ee8-32ee-4fde-9252-048caebd232e.png"> <br>
+<img style="width:100%; max-width:800px; max-height:600px; margin-left:auto; margin-right:auto; display:block;" src="/img/github/149951720-707f1ee8-32ee-4fde-9252-048caebd232e.png"> <br>
# 4. Performance Monitor
@@ -383,7 +383,7 @@ This section describes how to use the JConsole ```Mbean```tab of jconsole to mon
To grasp the performance of iotdb, this module is added to count the time-consumption of each operation. This module can compute the statistics of the avg time-consuming of each operation and the proportion of each operation whose time consumption falls into a time range. The output is in log_measure.log file. An output example is below.
-<img style="width:100%; max-width:800px; max-height:600px; margin-left:auto; margin-right:auto; display:block;" src="https://user-images.githubusercontent.com/13203019/60937461-14296f80-a303-11e9-9602-a7bed624bfb3.png">
+<img style="width:100%; max-width:800px; max-height:600px; margin-left:auto; margin-right:auto; display:block;" src="/img/github/60937461-14296f80-a303-11e9-9602-a7bed624bfb3.png">
## 4.2. Configuration parameter
@@ -403,4 +403,4 @@ To improve query performance, IOTDB caches ChunkMetaData and TsFileMetaData. Use
1. Connect to jconsole with port 31999 and select 'MBean' in the menu item above.
2. Expand the sidebar and select 'org.apache.iotdb.db.service'. You will get the results shown in the following figure:
-<img style="width:100%; max-width:800px; max-height:600px; margin-left:auto; margin-right:auto; display:block;" src="https://user-images.githubusercontent.com/19167280/112426760-73e3da80-8d73-11eb-9a8f-9232d1f2033b.png">
+<img style="width:100%; max-width:800px; max-height:600px; margin-left:auto; margin-right:auto; display:block;" src="/img/github/112426760-73e3da80-8d73-11eb-9a8f-9232d1f2033b.png">
diff --git a/docs/UserGuide/Operate-Metadata/Auto-Create-MetaData.md b/docs/UserGuide/Operate-Metadata/Auto-Create-MetaData.md
index 9ea5bdbb5d..18a4231463 100644
--- a/docs/UserGuide/Operate-Metadata/Auto-Create-MetaData.md
+++ b/docs/UserGuide/Operate-Metadata/Auto-Create-MetaData.md
@@ -51,7 +51,7 @@ Illustrated as the following figure:
* When default_storage_group_level=2, root.turbine1.d1, root.turbine1.d2, root.turbine2.d1 and root.turbine2.d2 will be set as storage group.
-<img style="width:100%; max-width:800px; max-height:600px; margin-left:auto; margin-right:auto; display:block;" src="https://github.com/apache/iotdb-bin-resources/blob/main/docs/UserGuide/Data%20Concept/Auto-Create-MetaData/auto_create_sg_example.png?raw=true" alt="auto create storage group example">
+<img style="width:100%; max-width:800px; max-height:600px; margin-left:auto; margin-right:auto; display:block;" src="/img/UserGuide/Data-Concept/Auto-Create-MetaData/auto_create_sg_example.png?raw=true" alt="auto create storage group example">
## Auto create time series metadata(specify data type in the frontend)
diff --git a/docs/UserGuide/Operate-Metadata/Timeseries.md b/docs/UserGuide/Operate-Metadata/Timeseries.md
index b67e6ec9f4..5b4c969733 100644
--- a/docs/UserGuide/Operate-Metadata/Timeseries.md
+++ b/docs/UserGuide/Operate-Metadata/Timeseries.md
@@ -181,7 +181,7 @@ It costs 0.004s
Then the Metadata Tree will be as below:
-<center><img style="width:100%; max-width:600px; margin-left:auto; margin-right:auto; display:block;" src="https://user-images.githubusercontent.com/19167280/69792176-1718f400-1201-11ea-861a-1a83c07ca144.jpg"></center>
+<center><img style="width:100%; max-width:600px; margin-left:auto; margin-right:auto; display:block;" src="/img/github/69792176-1718f400-1201-11ea-861a-1a83c07ca144.jpg"></center>
As can be seen, `root` is considered as `LEVEL=0`. So when you enter statements such as:
@@ -241,7 +241,7 @@ create timeseries root.turbine.d1.s1(temprature) with datatype=FLOAT, encoding=R
The `temprature` in the brackets is an alias for the sensor `s1`. So we can use `temprature` to replace `s1` anywhere.
-> IoTDB also supports [using AS function](../Reference/DML-Data-Manipulation-Language.md) to set alias. The difference between the two is: the alias set by the AS function is used to replace the whole time series name, temporary and not bound with the time series; while the alias mentioned above is only used as the alias of the sensor, which is bound with it and can be used equivalent to the original sensor name.
+> IoTDB also supports [using AS function](../Query-Data/Select-Expression.html#use-alias) to set alias. The difference between the two is: the alias set by the AS function is used to replace the whole time series name, temporary and not bound with the time series; while the alias mentioned above is only used as the alias of the sensor, which is bound with it and can be used equivalent to the original sensor name.
> Notice that the size of the extra tag and attribute information shouldn't exceed the `tag_attribute_total_size`.
diff --git a/docs/UserGuide/Process-Data/Alerting.md b/docs/UserGuide/Process-Data/Alerting.md
index 3e2f2530ae..02f08579e7 100644
--- a/docs/UserGuide/Process-Data/Alerting.md
+++ b/docs/UserGuide/Process-Data/Alerting.md
@@ -380,6 +380,6 @@ makes alerts of `critical` severity inhibit those of `warning` severity,
the alerting email we receive only contains the alert triggered
by the writing of `(5, 120)`.
-<img width="669" alt="alerting" src="https://user-images.githubusercontent.com/34649843/115957896-a9791080-a537-11eb-9962-541412bdcee6.png">
+<img width="669" alt="alerting" src="/img/github/115957896-a9791080-a537-11eb-9962-541412bdcee6.png">
diff --git a/docs/UserGuide/Process-Data/Triggers.md b/docs/UserGuide/Process-Data/Triggers.md
index 9b7afd6f64..425fa0b364 100644
--- a/docs/UserGuide/Process-Data/Triggers.md
+++ b/docs/UserGuide/Process-Data/Triggers.md
@@ -306,7 +306,7 @@ When a user manages triggers, 4 types of authorities will be involved:
* `START_TRIGGER`: Only users with this authority are allowed to start triggers. This authority is path dependent.
* `STOP_TRIGGER`: Only users with this authority are allowed to stop triggers. This authority is path dependent.
-For more information, refer to [Authority Management Statement](../Operation%20Manual/Administration.md).
+For more information, refer to [Authority Management Statement](../Administration-Management/Administration.md).
diff --git a/docs/UserGuide/Process-Data/UDF-User-Defined-Function.md b/docs/UserGuide/Process-Data/UDF-User-Defined-Function.md
index 6d3eee305c..5539d5dd98 100644
--- a/docs/UserGuide/Process-Data/UDF-User-Defined-Function.md
+++ b/docs/UserGuide/Process-Data/UDF-User-Defined-Function.md
@@ -190,7 +190,7 @@ The sliding step parameter is also optional. If the parameter is not provided, t
The relationship between the three types of parameters can be seen in the figure below. Please see the Javadoc for more details.
-<div style="text-align: center;"><img style="width:100%; max-width:800px; max-height:600px; margin-left:auto; margin-right:auto; display:block;" src="https://user-images.githubusercontent.com/30497621/99787878-47b51480-2b5b-11eb-8ed3-84088c5c30f7.png"></div>
+<div style="text-align: center;"><img style="width:100%; max-width:800px; max-height:600px; margin-left:auto; margin-right:auto; display:block;" src="/img/github/99787878-47b51480-2b5b-11eb-8ed3-84088c5c30f7.png"></div>
Note that the actual time interval of some of the last time windows may be less than the specified time interval parameter. In addition, there may be cases where the number of data rows in some time windows is 0. In these cases, the framework will also call the `transform` method for the empty windows.
diff --git a/docs/UserGuide/Query-Data/Aggregate-Query.md b/docs/UserGuide/Query-Data/Aggregate-Query.md
index 2f299a9179..ca05263a4e 100644
--- a/docs/UserGuide/Query-Data/Aggregate-Query.md
+++ b/docs/UserGuide/Query-Data/Aggregate-Query.md
@@ -179,7 +179,7 @@ The GROUP BY statement provides users with three types of specified parameters:
The actual meanings of the three types of parameters are shown in Figure below.
Among them, the parameter 3 is optional.
-<center><img style="width:100%; max-width:800px; max-height:600px; margin-left:auto; margin-right:auto; display:block;" src="https://user-images.githubusercontent.com/16079446/69109512-f808bc80-0ab2-11ea-9e4d-b2b2f58fb474.png">
+<center><img style="width:100%; max-width:800px; max-height:600px; margin-left:auto; margin-right:auto; display:block;" src="/img/github/69109512-f808bc80-0ab2-11ea-9e4d-b2b2f58fb474.png">
</center>
There are three typical examples of frequency reduction aggregation:
diff --git a/docs/UserGuide/Query-Data/Fill-Null-Value.md b/docs/UserGuide/Query-Data/Fill-Null-Value.md
index 8b7be9f676..b2ca5bea89 100644
--- a/docs/UserGuide/Query-Data/Fill-Null-Value.md
+++ b/docs/UserGuide/Query-Data/Fill-Null-Value.md
@@ -39,7 +39,6 @@ IoTDB supports previous, linear, and value fill methods. Following table lists t
| float | previous, linear, value |
| double | previous, linear, value |
| text | previous |
-| </center> | |
> Note: Only one Fill method can be specified in a Fill statement. Null value fill is compatible with version 0.12 and previous syntax (fill((<data_type>[<fill_method>(, <before_range>, <after_range>)?])+)), but the old syntax could not specify multiple fill methods at the same time
@@ -63,7 +62,6 @@ Detailed descriptions of all parameters are given in following table:
| path, prefixPath | query path; mandatory field |
| T | query timestamp (only one can be specified); mandatory field |
| before\_range | represents the valid time range of the previous method. The previous method works when there are values in the [T-before\_range, T] range. When before\_range is not specified, before\_range takes the default value default\_fill\_interval; -1 represents infinit; optional field |
-| </center> | |
Here we give an example of filling null values using the previous method. The SQL statement is as follows:
@@ -113,7 +111,6 @@ Detailed descriptions of all parameters are given in following table:
| path, prefixPath | query path; mandatory field |
| T | query timestamp (only one can be specified); mandatory field |
| before\_range, after\_range | represents the valid time range of the linear method. The previous method works when there are values in the [T-before\_range, T+after\_range] range. When before\_range and after\_range are not explicitly specified, default\_fill\_interval is used. -1 represents infinity; optional field |
-| </center> | |
**Note** if the timeseries has a valid value at query timestamp T, this value will be used as the linear fill value.
Otherwise, if there is no valid fill value in either range [T - before_range, T] or [T, T + after_range], linear fill method will return null.
@@ -153,7 +150,6 @@ Detailed descriptions of all parameters are given in following table:
| path, prefixPath | query path; mandatory field |
| T | query timestamp (only one can be specified); mandatory field |
| constant | represents given fill value |
-| </center> | |
**Note** if the timeseries has a valid value at query timestamp T, this value will be used as the specific fill value.
diff --git a/docs/UserGuide/Query-Data/Select-Expression.md b/docs/UserGuide/Query-Data/Select-Expression.md
index 6b3d8116d6..29cecd1f35 100644
--- a/docs/UserGuide/Query-Data/Select-Expression.md
+++ b/docs/UserGuide/Query-Data/Select-Expression.md
@@ -475,10 +475,10 @@ They can be divided into two categories according to return value:
| Function Name | Input TSDatatype | Parameters | Output TSDatatype | Function Description |
|-------------------|--------------------------------------|-----------------------------------------------------------------------------------------------|-------------------|------------------------------------------------------------------------------------------------------------------------------------------------------------------------------|
-| ZERO_DURATION | INT32/ INT64/ FLOAT/ DOUBLE/ BOOLEAN | `min`:Optional with default value `0L`</br>`max`:Optional with default value `Long.MAX_VALUE` | Long | Return intervals' start times and duration times in which the value is always 0(false), and the duration time `t` satisfy `t >= min && t <= max`. The unit of `t` is ms |
-| NON_ZERO_DURATION | INT32/ INT64/ FLOAT/ DOUBLE/ BOOLEAN | `min`:Optional with default value `0L`</br>`max`:Optional with default value `Long.MAX_VALUE` | Long | Return intervals' start times and duration times in which the value is always not 0, and the duration time `t` satisfy `t >= min && t <= max`. The unit of `t` is ms |
-| ZERO_COUNT | INT32/ INT64/ FLOAT/ DOUBLE/ BOOLEAN | `min`:Optional with default value `1L`</br>`max`:Optional with default value `Long.MAX_VALUE` | Long | Return intervals' start times and the number of data points in the interval in which the value is always 0(false). Data points number `n` satisfy `n >= min && n <= max` |
-| NON_ZERO_COUNT | INT32/ INT64/ FLOAT/ DOUBLE/ BOOLEAN | `min`:Optional with default value `1L`</br>`max`:Optional with default value `Long.MAX_VALUE` | Long | Return intervals' start times and the number of data points in the interval in which the value is always not 0(false). Data points number `n` satisfy `n >= min && n <= max` |
+| ZERO_DURATION | INT32/ INT64/ FLOAT/ DOUBLE/ BOOLEAN | `min`:Optional with default value `0L`<br>`max`:Optional with default value `Long.MAX_VALUE` | Long | Return intervals' start times and duration times in which the value is always 0(false), and the duration time `t` satisfy `t >= min && t <= max`. The unit of `t` is ms |
+| NON_ZERO_DURATION | INT32/ INT64/ FLOAT/ DOUBLE/ BOOLEAN | `min`:Optional with default value `0L`<br>`max`:Optional with default value `Long.MAX_VALUE` | Long | Return intervals' start times and duration times in which the value is always not 0, and the duration time `t` satisfy `t >= min && t <= max`. The unit of `t` is ms |
+| ZERO_COUNT | INT32/ INT64/ FLOAT/ DOUBLE/ BOOLEAN | `min`:Optional with default value `1L`<br>`max`:Optional with default value `Long.MAX_VALUE` | Long | Return intervals' start times and the number of data points in the interval in which the value is always 0(false). Data points number `n` satisfy `n >= min && n <= max` |
+| NON_ZERO_COUNT | INT32/ INT64/ FLOAT/ DOUBLE/ BOOLEAN | `min`:Optional with default value `1L`<br>`max`:Optional with default value `Long.MAX_VALUE` | Long | Return intervals' start times and the number of data points in the interval in which the value is always not 0(false). Data points number `n` satisfy `n >= min && n <= max` |
##### Demonstrate
Example data:
diff --git a/docs/UserGuide/QuickStart/Command-Line-Interface.md b/docs/UserGuide/QuickStart/Command-Line-Interface.md
index f51e9bd78a..aad3c14003 100644
--- a/docs/UserGuide/QuickStart/Command-Line-Interface.md
+++ b/docs/UserGuide/QuickStart/Command-Line-Interface.md
@@ -44,9 +44,9 @@ After installation, there is a default user in IoTDB: `root`, and the
default password is `root`. Users can use this username to try IoTDB Cli/Shell tool. The cli startup script is the `start-cli` file under the \$IOTDB\_HOME/bin folder. When starting the script, you need to specify the IP and PORT. (Make sure the IoTDB server is running properly when you use Cli/Shell tool to connect it.)
Here is an example where the server is started locally and the user has not changed the running port. The default rpc port is
-6667 </br>
+6667 <br>
If you need to connect to the remote server or changes
-the rpc port number of the server running, set the specific IP and RPC PORT at -h and -p.</br>
+the rpc port number of the server running, set the specific IP and RPC PORT at -h and -p.<br>
You also can set your own environment variable at the front of the start script ("/sbin/start-cli.sh" for linux and "/sbin/start-cli.bat" for windows)
The Linux and MacOS system startup commands are as follows:
@@ -127,48 +127,48 @@ Shell >cd bin
Shell >./standalone.sh
```
2、use url(https://ip:port/auth) login keycloack, the first login needs to create a user
-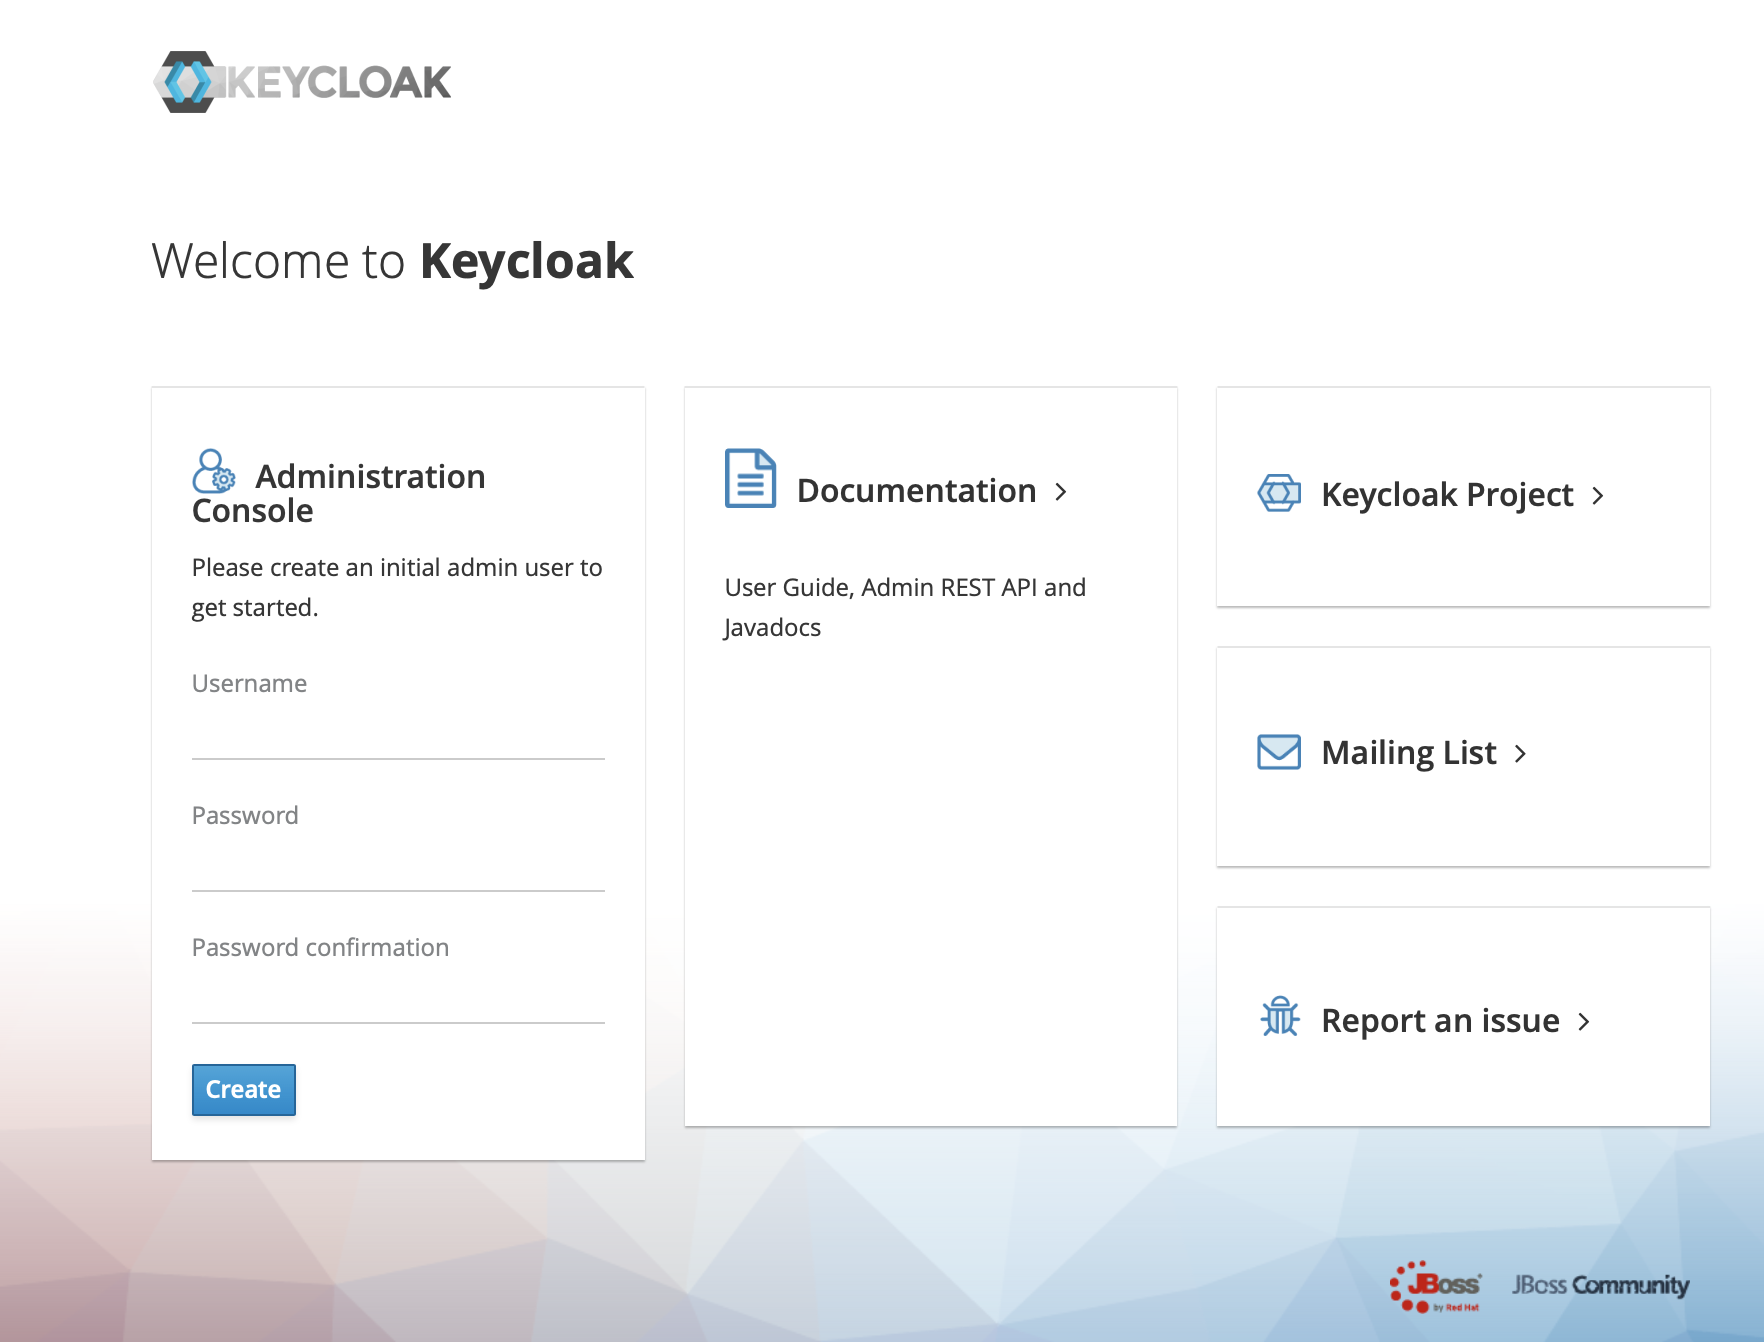
+
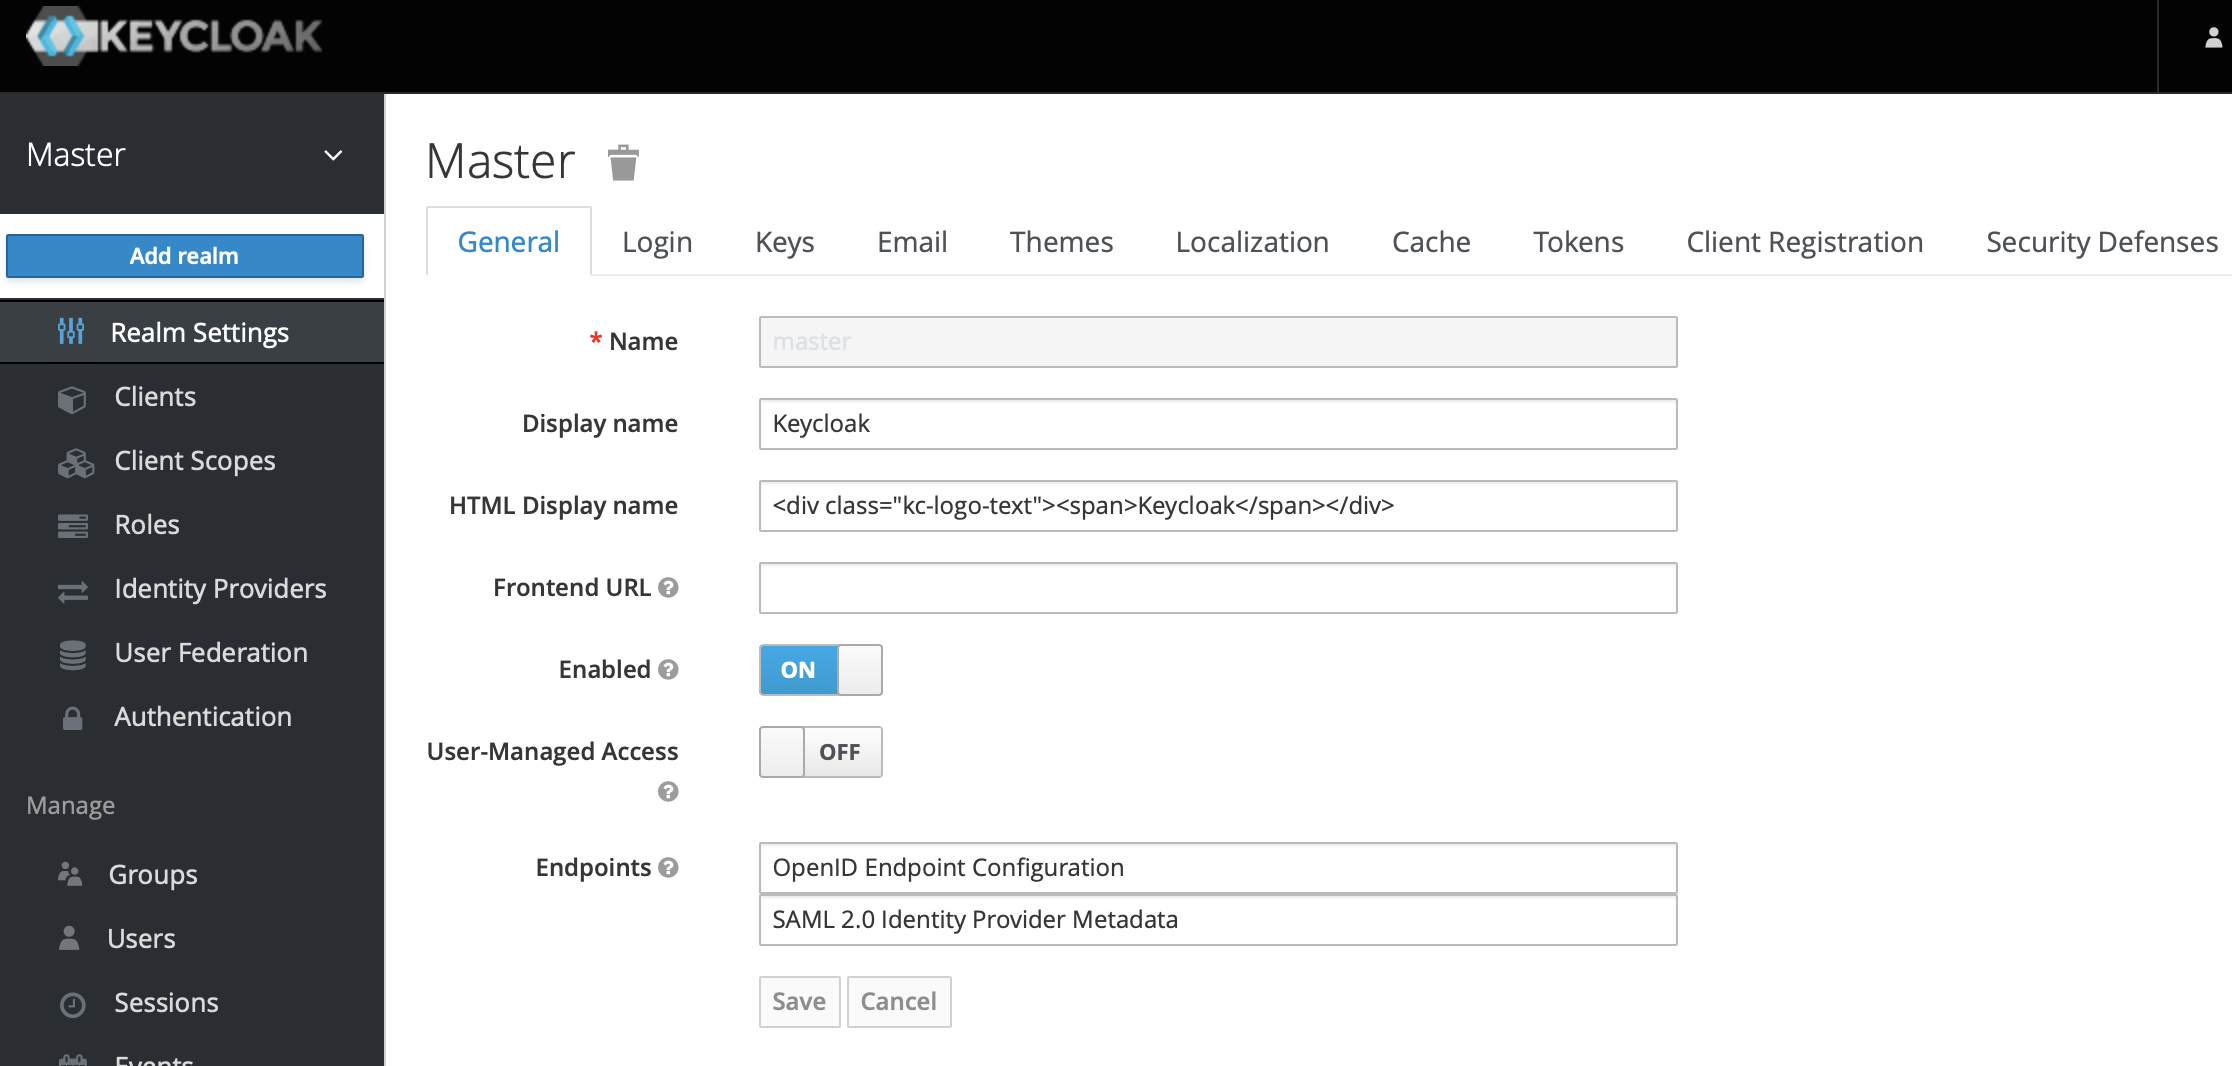
3、Click administration console
-
+
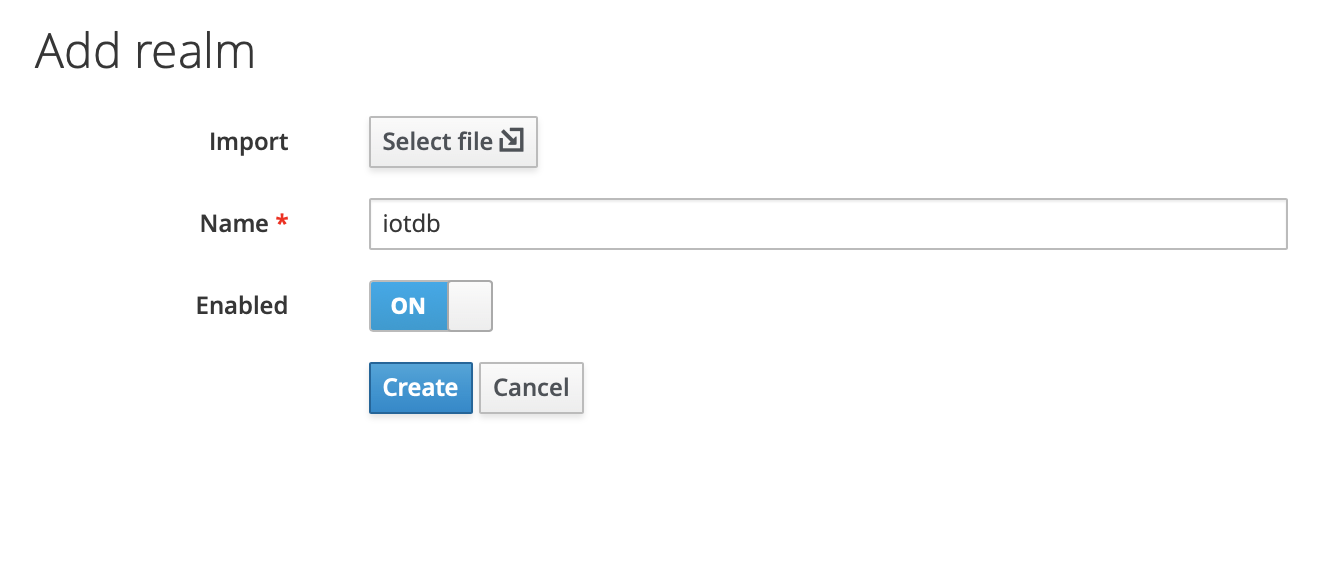
4、In the master menu on the left, click Add realm and enter name to create a new realm
-
+
-
+
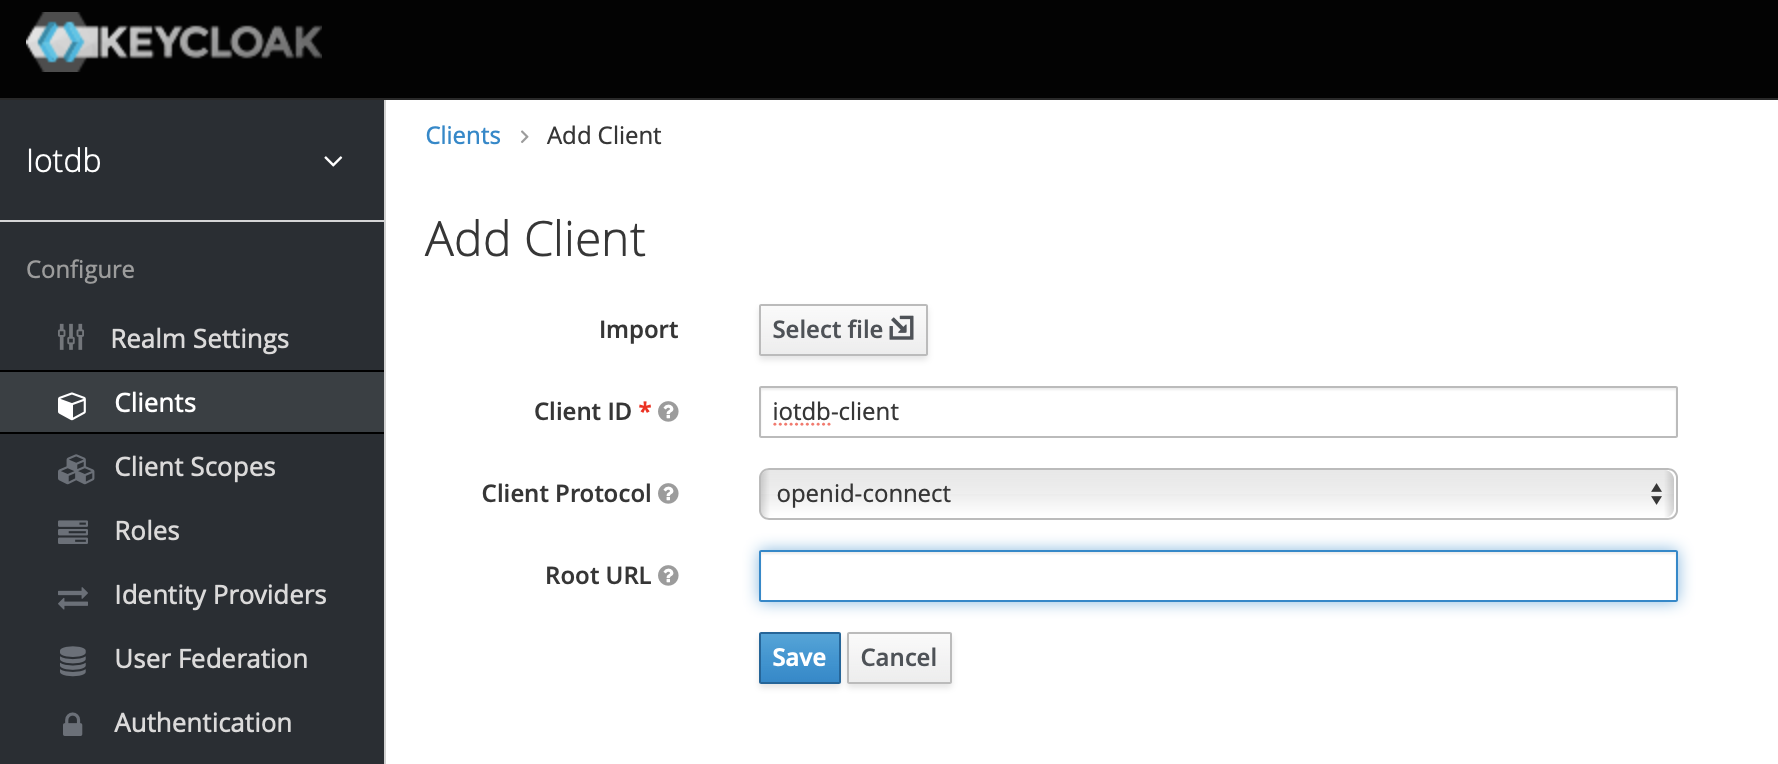
5、Click the menu clients on the left to create clients
-
+
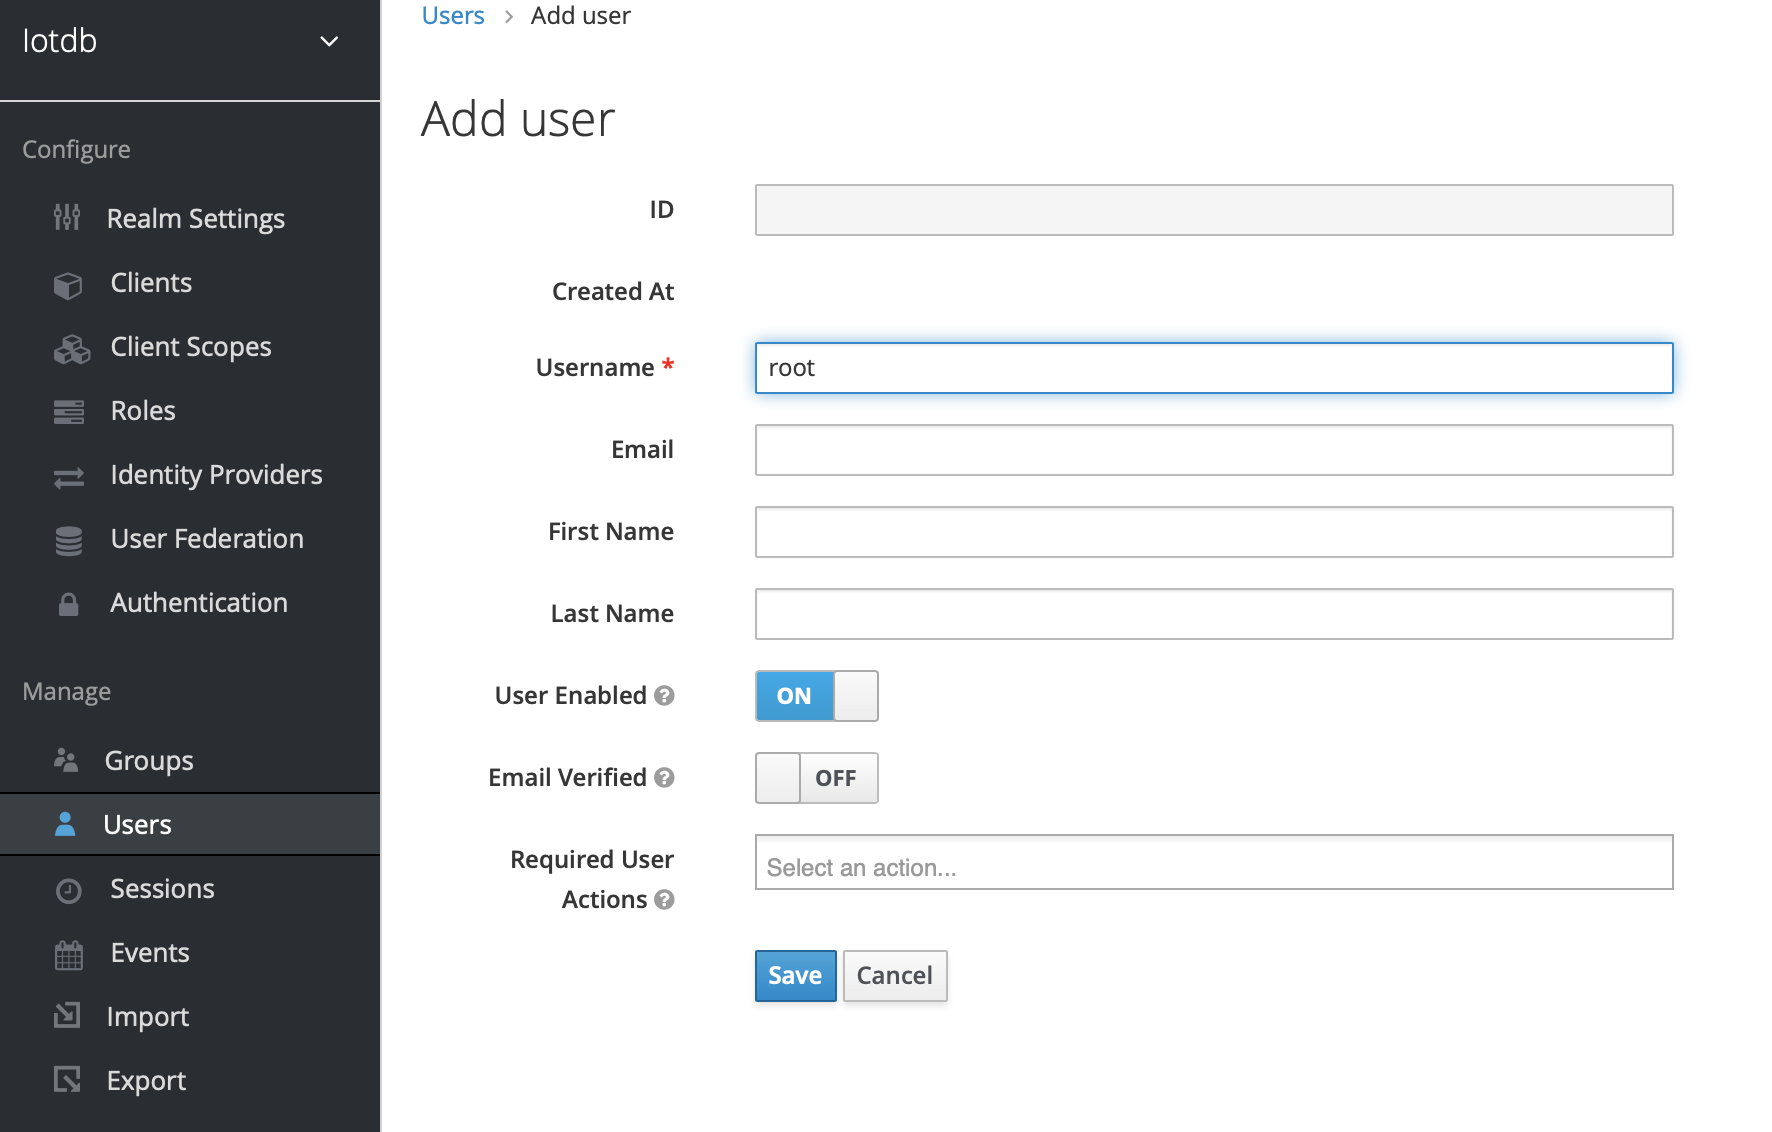
6、Click user on the left menu to create user
-
+
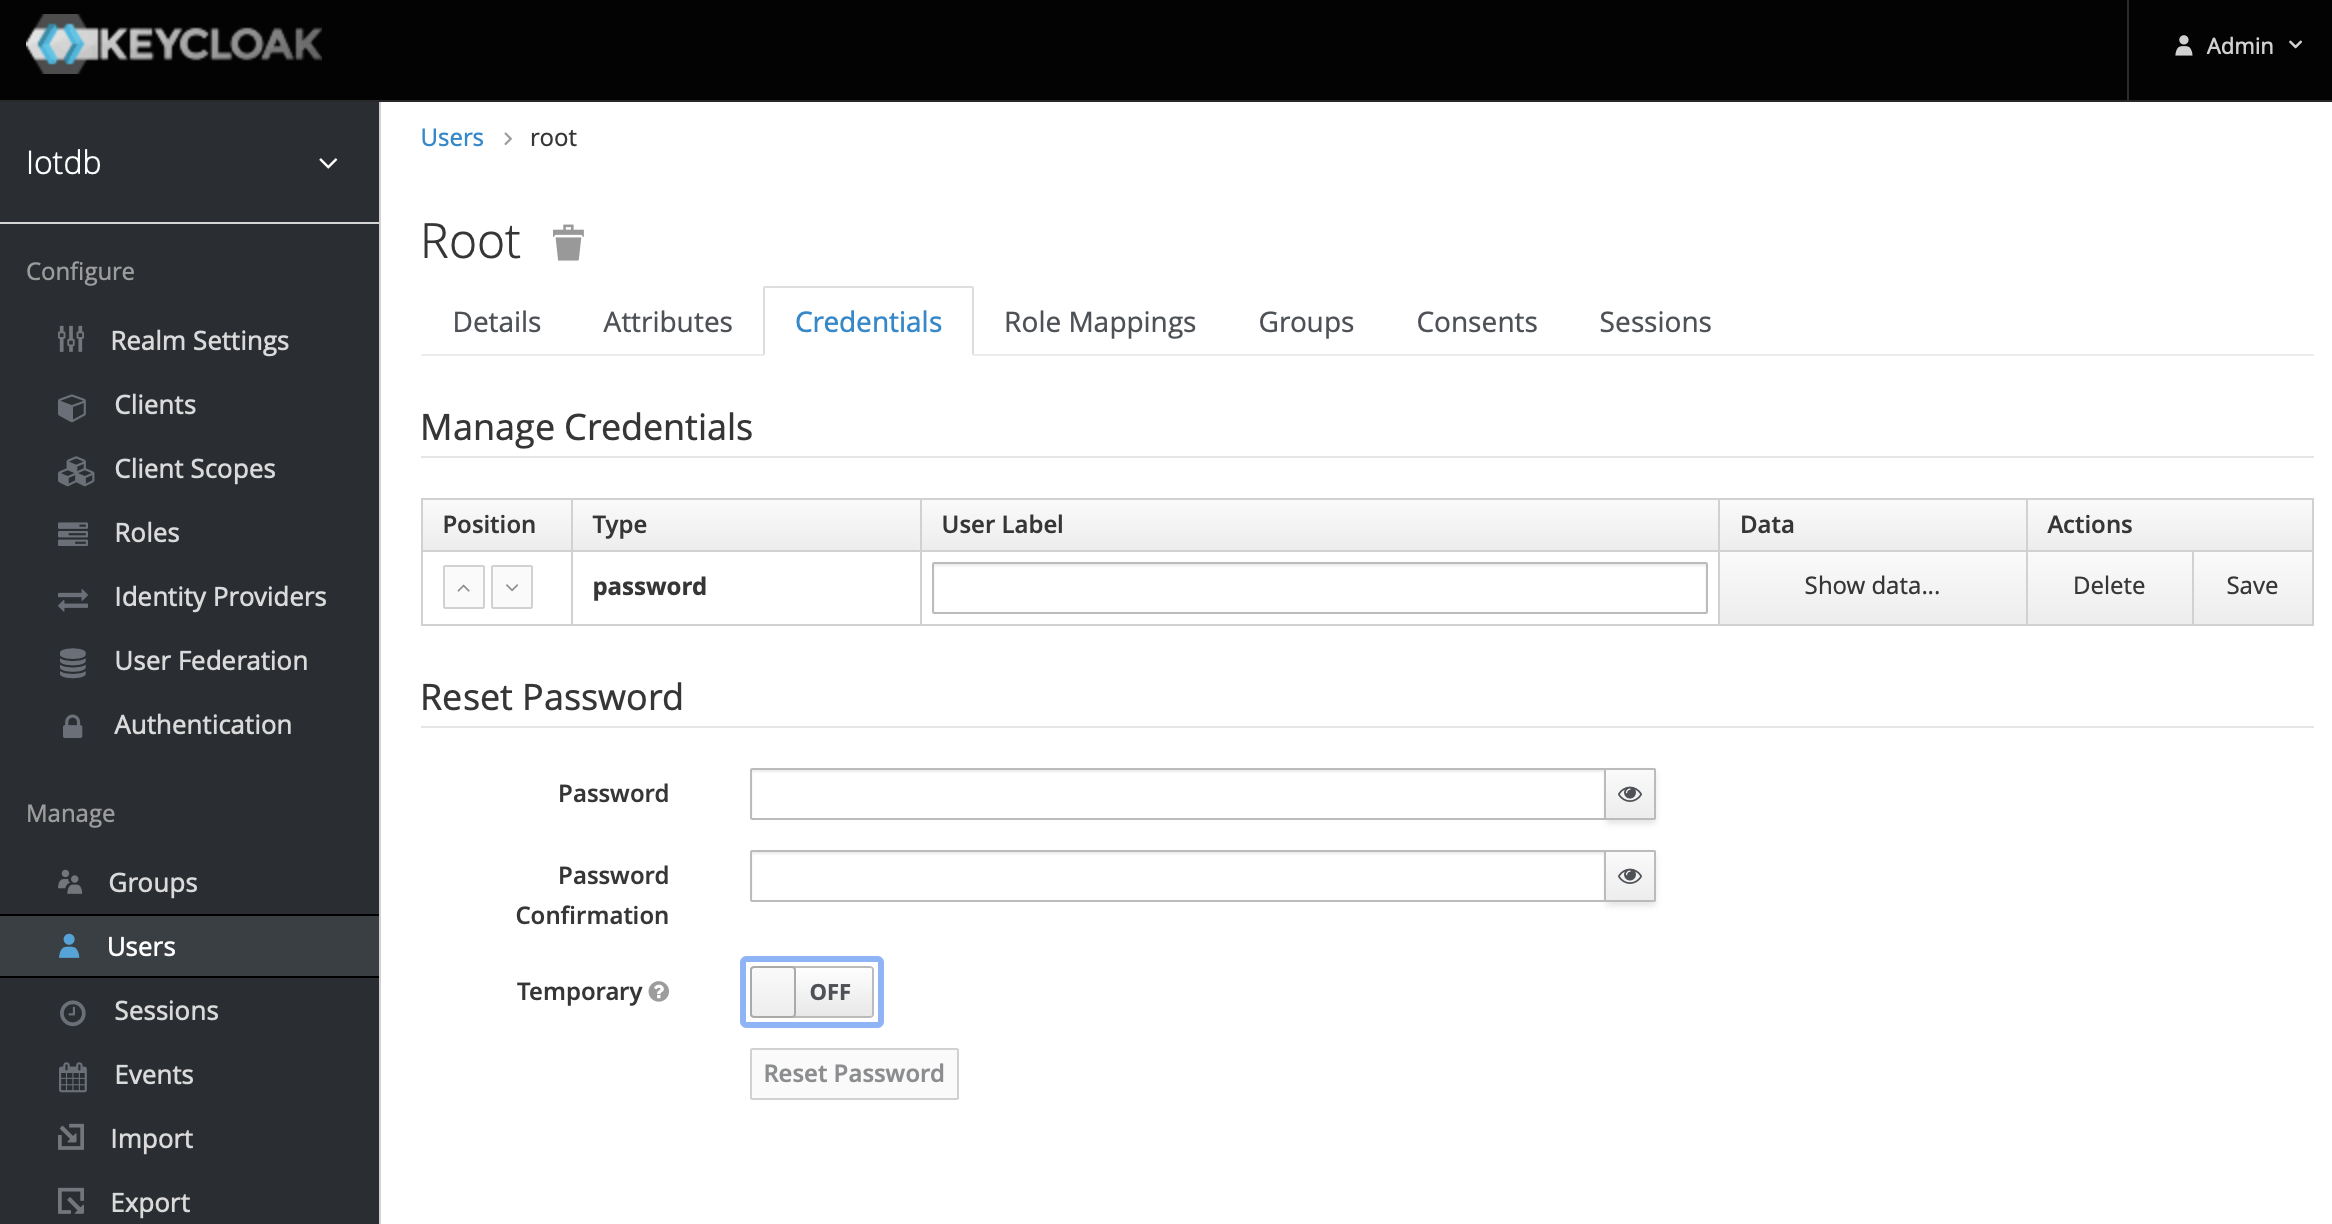
7、Click the newly created user ID, click the credentials navigation, enter the password and close the temporary option. The configuration of keycloud is completed
-
+
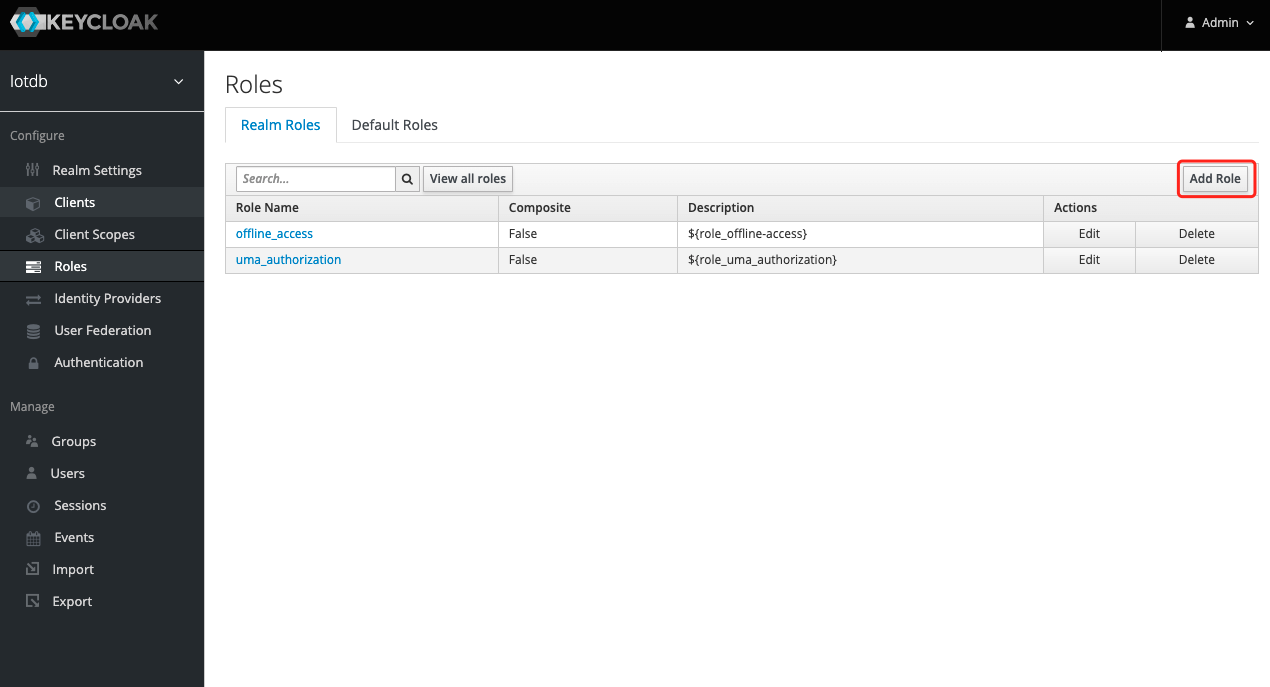
8、To create a role, click Roles on the left menu and then click the Add Role button to add a role
-
+
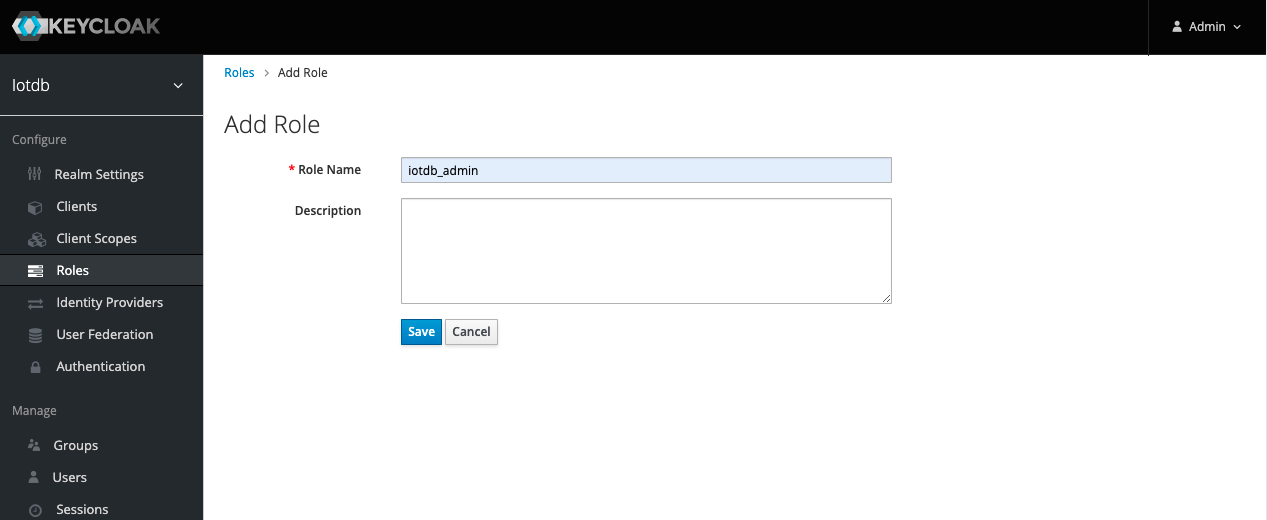
9、 Enter `iotdb_admin` in the Role Name and click the save button. Tip: `iotdb_admin` here cannot be any other name, otherwise even after successful login, you will not have permission to use iotdb's query, insert, create storage group, add users, roles and other functions
-
+
10、Click the User menu on the left and click the Edit button in the user list to add the `iotdb_admin` role we just created for this user
-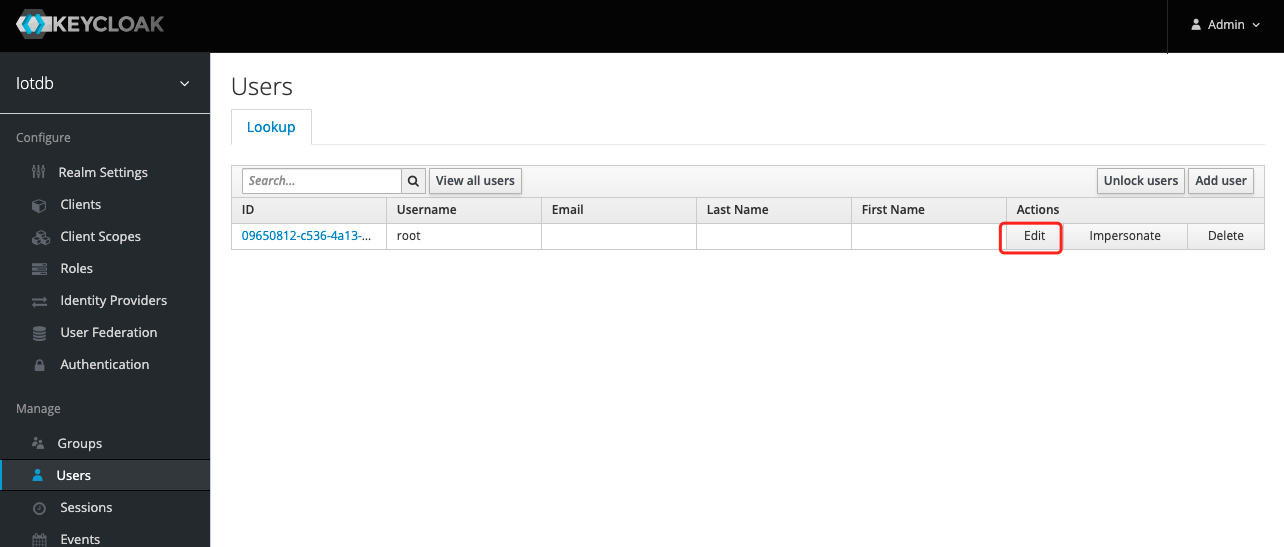
+
11、 Select Role Mappings, select the `iotdb_admin` role in Available Role and click the Add selected button to add the role
-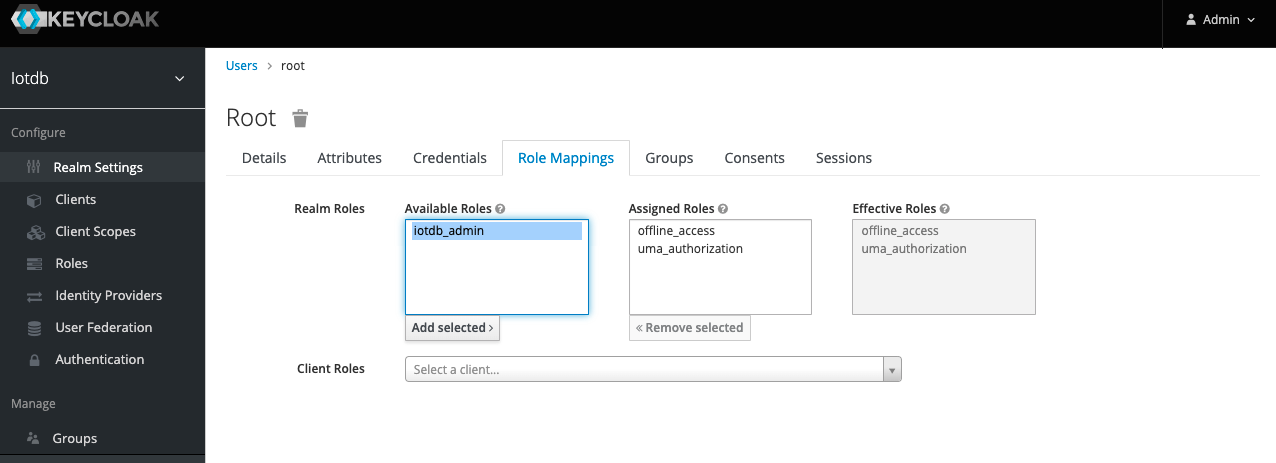
+
12. If the `iotdb_admin` role is in Assigned Roles and the `Success Role mappings updated` prompt appears, it proves that the role was added successfully
-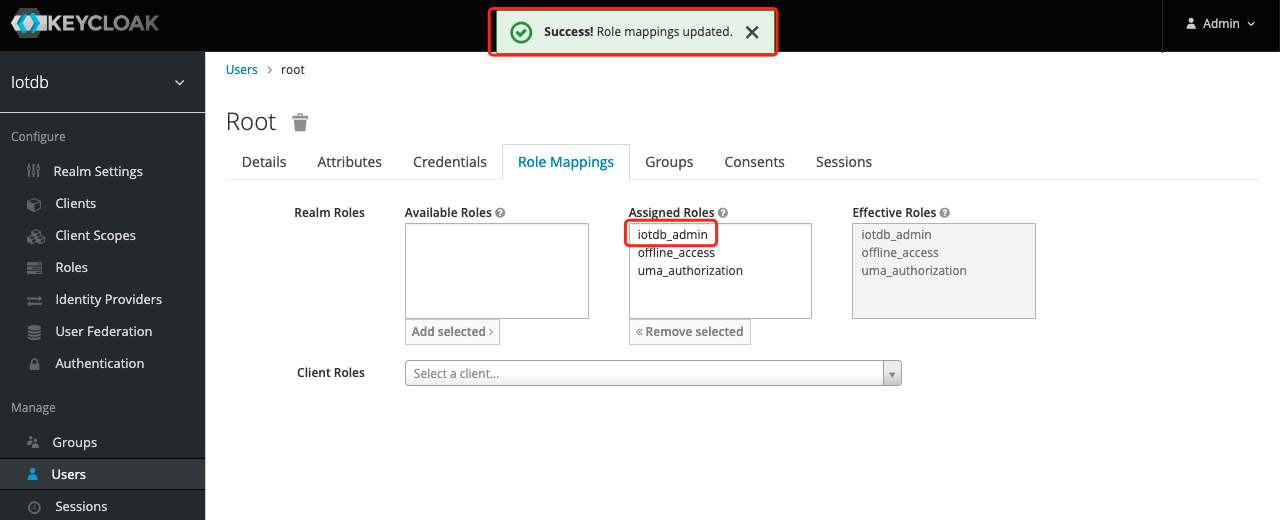
+
Tip: If the user role is adjusted, you need to regenerate the token and log in to iotdb again to take effect
diff --git a/docs/UserGuide/QuickStart/QuickStart.md b/docs/UserGuide/QuickStart/QuickStart.md
index 58f6fef090..2a6a765017 100644
--- a/docs/UserGuide/QuickStart/QuickStart.md
+++ b/docs/UserGuide/QuickStart/QuickStart.md
@@ -36,7 +36,7 @@ IoTDB provides you three installation methods, you can refer to the following su
* Installation from source code. If you need to modify the code yourself, you can use this method.
* Installation from binary files. Download the binary files from the official website. This is the recommended method, in which you will get a binary released package which is out-of-the-box.(Coming Soon...)
-* Using Docker:The path to the dockerfile is https://github.com/apache/iotdb/blob/master/docker/src/main
+* Using Docker:The path to the dockerfile is [github](https://github.com/apache/iotdb/blob/master/docker/src/main)
## Download
diff --git a/docs/UserGuide/Reference/Config-Manual.md b/docs/UserGuide/Reference/Config-Manual.md
index 5596cb2098..b266b08390 100644
--- a/docs/UserGuide/Reference/Config-Manual.md
+++ b/docs/UserGuide/Reference/Config-Manual.md
@@ -422,7 +422,7 @@ The permission definitions are in ${IOTDB\_CONF}/conf/jmx.access.
|Name| concurrent\_writing\_time\_partition |
|:---:|:---|
-|Description| This config decides how many time partitions in a storage group can be inserted concurrently </br> For example, your partitionInterval is 86400 and you want to insert data in 5 different days, |
+|Description| This config decides how many time partitions in a storage group can be inserted concurrently <br> For example, your partitionInterval is 86400 and you want to insert data in 5 different days, |
|Type|Int32|
|Default| 1 |
|Effective|After restarting system|
diff --git a/docs/UserGuide/Reference/SQL-Reference.md b/docs/UserGuide/Reference/SQL-Reference.md
index 0c4f56c19f..0f339eb13e 100644
--- a/docs/UserGuide/Reference/SQL-Reference.md
+++ b/docs/UserGuide/Reference/SQL-Reference.md
@@ -1240,7 +1240,7 @@ Note: DateTime Type can support several types, see Chapter 3 Datetime section fo
PrecedenceEqualOperator : EQUAL | NOTEQUAL | LESSTHANOREQUALTO | LESSTHAN | GREATERTHANOREQUALTO | GREATERTHAN
```
```
-Timeseries : ROOT [DOT <LayerName>]* DOT <SensorName>
+Timeseries : ROOT [DOT \<LayerName\>]* DOT \<SensorName\>
LayerName : Identifier
SensorName : Identifier
eg. root.ln.wf01.wt01.status
@@ -1249,7 +1249,7 @@ Note: Timeseries must be start with `root`(case insensitive) and end with sensor
```
```
-PrefixPath : ROOT (DOT <LayerName>)*
+PrefixPath : ROOT (DOT \<LayerName\>)*
LayerName : Identifier | STAR
eg. root.sgcc
eg. root.*
diff --git a/docs/UserGuide/Reference/TSDB-Comparison.md b/docs/UserGuide/Reference/TSDB-Comparison.md
index 979a61f16b..76f9db1166 100644
--- a/docs/UserGuide/Reference/TSDB-Comparison.md
+++ b/docs/UserGuide/Reference/TSDB-Comparison.md
@@ -23,7 +23,7 @@
## Overview
-
+
@@ -323,7 +323,7 @@ IoTDB uses batch insertion API and the batch size is distributed from 0 to 6000
The write throughput (points/second) is:
-
+
<span id = "exp1"> <center>Figure 1. Batch Size with Write throughput (points/second) IoTDB v0.11.1</center></span>
* client num:
@@ -333,24 +333,24 @@ IoTDB uses batch insertion API and the batch size is 100 (write 100 data points
The write throughput (points/second) is:
-
+
<center>Figure 3. Client Num with Write Throughput (points/second) IoTDB v0.11.1</center>
**Query performance**
-
+
<center>Figure 4. Raw data query 1 col time cost(ms) IoTDB v0.11.1</center>
-
+
<center>Figure 5. Aggregation query time cost(ms) IoTDB v0.11.1</center>
-
+
<center>Figure 6. Downsampling query time cost(ms) IoTDB v0.11.1</center>
-
+
<center>Figure 7. Latest query time cost(ms) IoTDB v0.11.1</center>
-
+
<center>Figure 8. Data compression IoTDB v0.11.1</center>
We can see that IoTDB outperforms others.
diff --git a/docs/UserGuide/UserGuideReadme.md b/docs/UserGuide/UserGuideReadme.md
index 4c6c9d4cb7..e5201f0297 100644
--- a/docs/UserGuide/UserGuideReadme.md
+++ b/docs/UserGuide/UserGuideReadme.md
@@ -26,7 +26,6 @@ The "In Progress Version" is for matching the master branch of IOTDB's source co
Other documents are for IoTDB previous released versions.
- [In progress version](https://iotdb.apache.org/UserGuide/Master/QuickStart/QuickStart.html)
-- [Version 0.10.x](https://iotdb.apache.org/UserGuide/V0.10.x/Get%20Started/QuickStart.html)
-- [Version 0.9.x](https://iotdb.apache.org/UserGuide/V0.9.x/0-Get%20Started/1-QuickStart.html)
-- [Version 0.8.x](https://iotdb.apache.org/UserGuide/V0.8.x/0-Get%20Started/1-QuickStart.html)
+- [Version 1.0.x](https://iotdb.apache.org/UserGuide/V1.0.x/QuickStart/QuickStart.html)
+- [Version 0.13.x](https://iotdb.apache.org/UserGuide/V0.13.x/QuickStart/QuickStart.html)
diff --git a/docs/zh/UserGuide/API/InfluxDB-Protocol.md b/docs/zh/UserGuide/API/InfluxDB-Protocol.md
index 82bc449421..18aab0ba5e 100644
--- a/docs/zh/UserGuide/API/InfluxDB-Protocol.md
+++ b/docs/zh/UserGuide/API/InfluxDB-Protocol.md
@@ -39,9 +39,9 @@ InfluxDB influxDB = IoTDBInfluxDBFactory.connect(openurl, username, password);
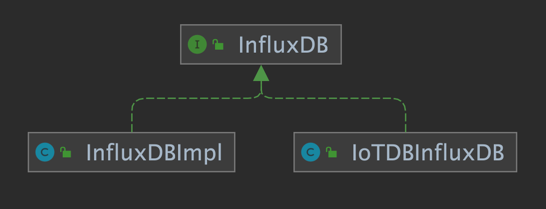
该适配器以 IoTDB Java Session 接口为底层基础,实现了 InfluxDB 的 Java 接口 `interface InfluxDB`,对用户提供了所有 InfluxDB 的接口方法,最终用户可以无感知地使用 InfluxDB 协议向 IoTDB 发起写入和读取请求。
-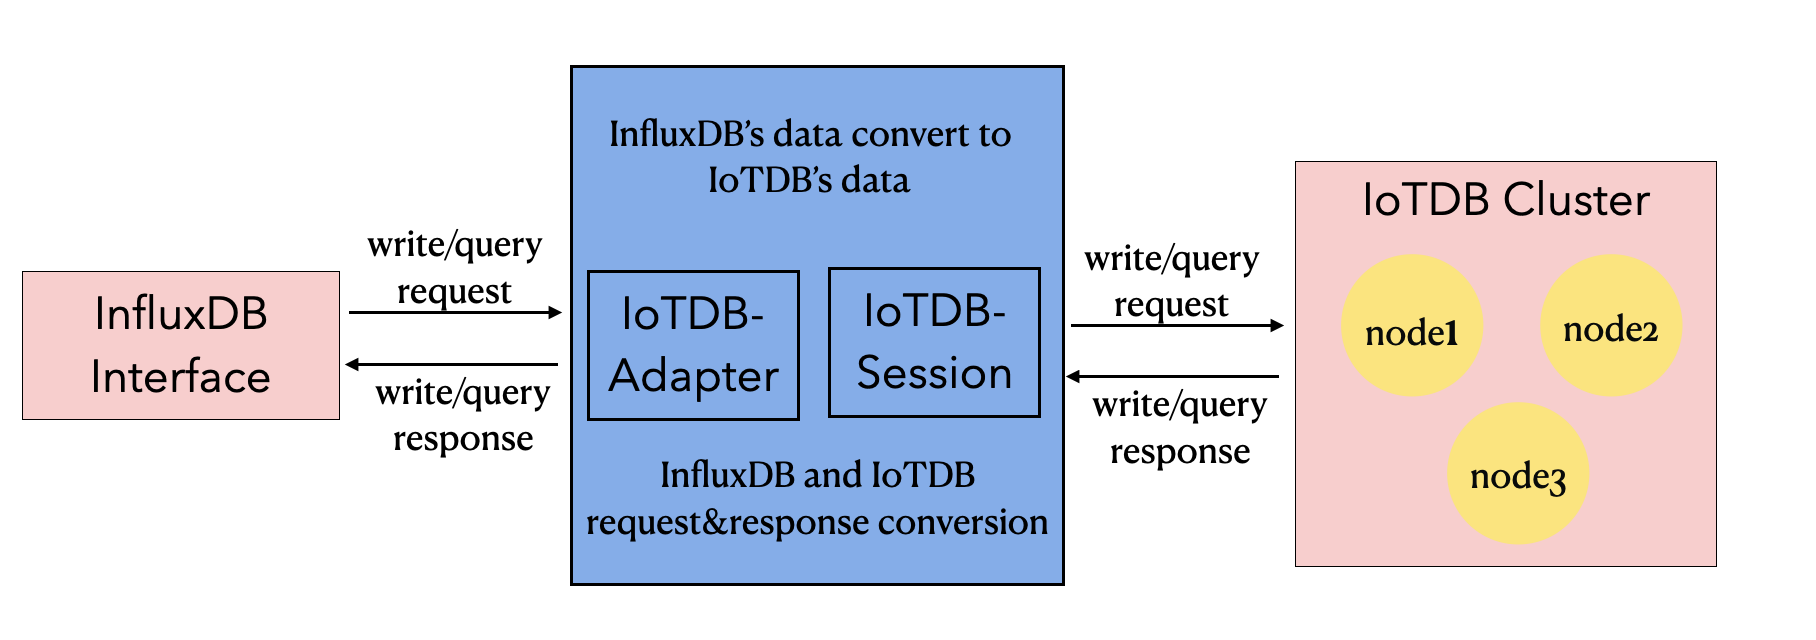
+
-
+
#### 2.2 元数据格式转换
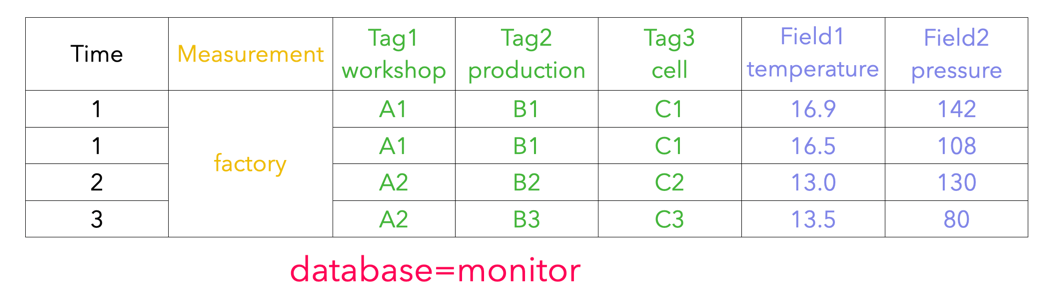
@@ -55,7 +55,7 @@ InfluxDB 的元数据是 tag-field 模型,IoTDB 的元数据是树形模型。
3. tags : 各种有索引的属性。
4. fields : 各种记录值(没有索引的属性)。
-
+
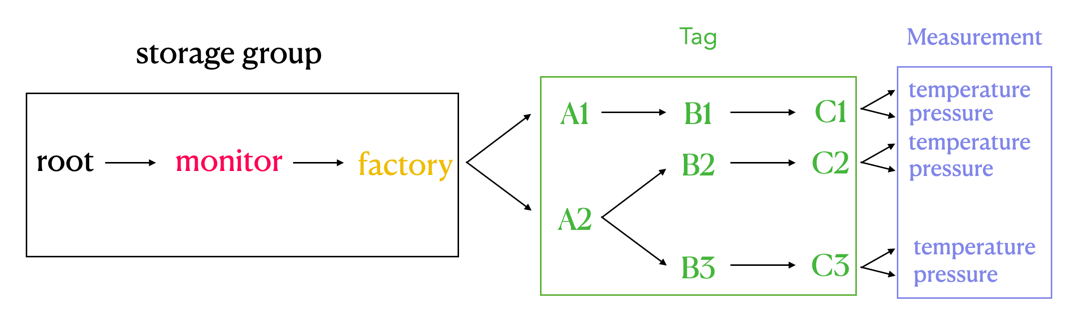
##### 2.2.2 IoTDB 元数据
@@ -63,7 +63,7 @@ InfluxDB 的元数据是 tag-field 模型,IoTDB 的元数据是树形模型。
2. path(time series ID):存储路径。
3. measurement: 物理量。
-
+
##### 2.2.3 两者映射关系
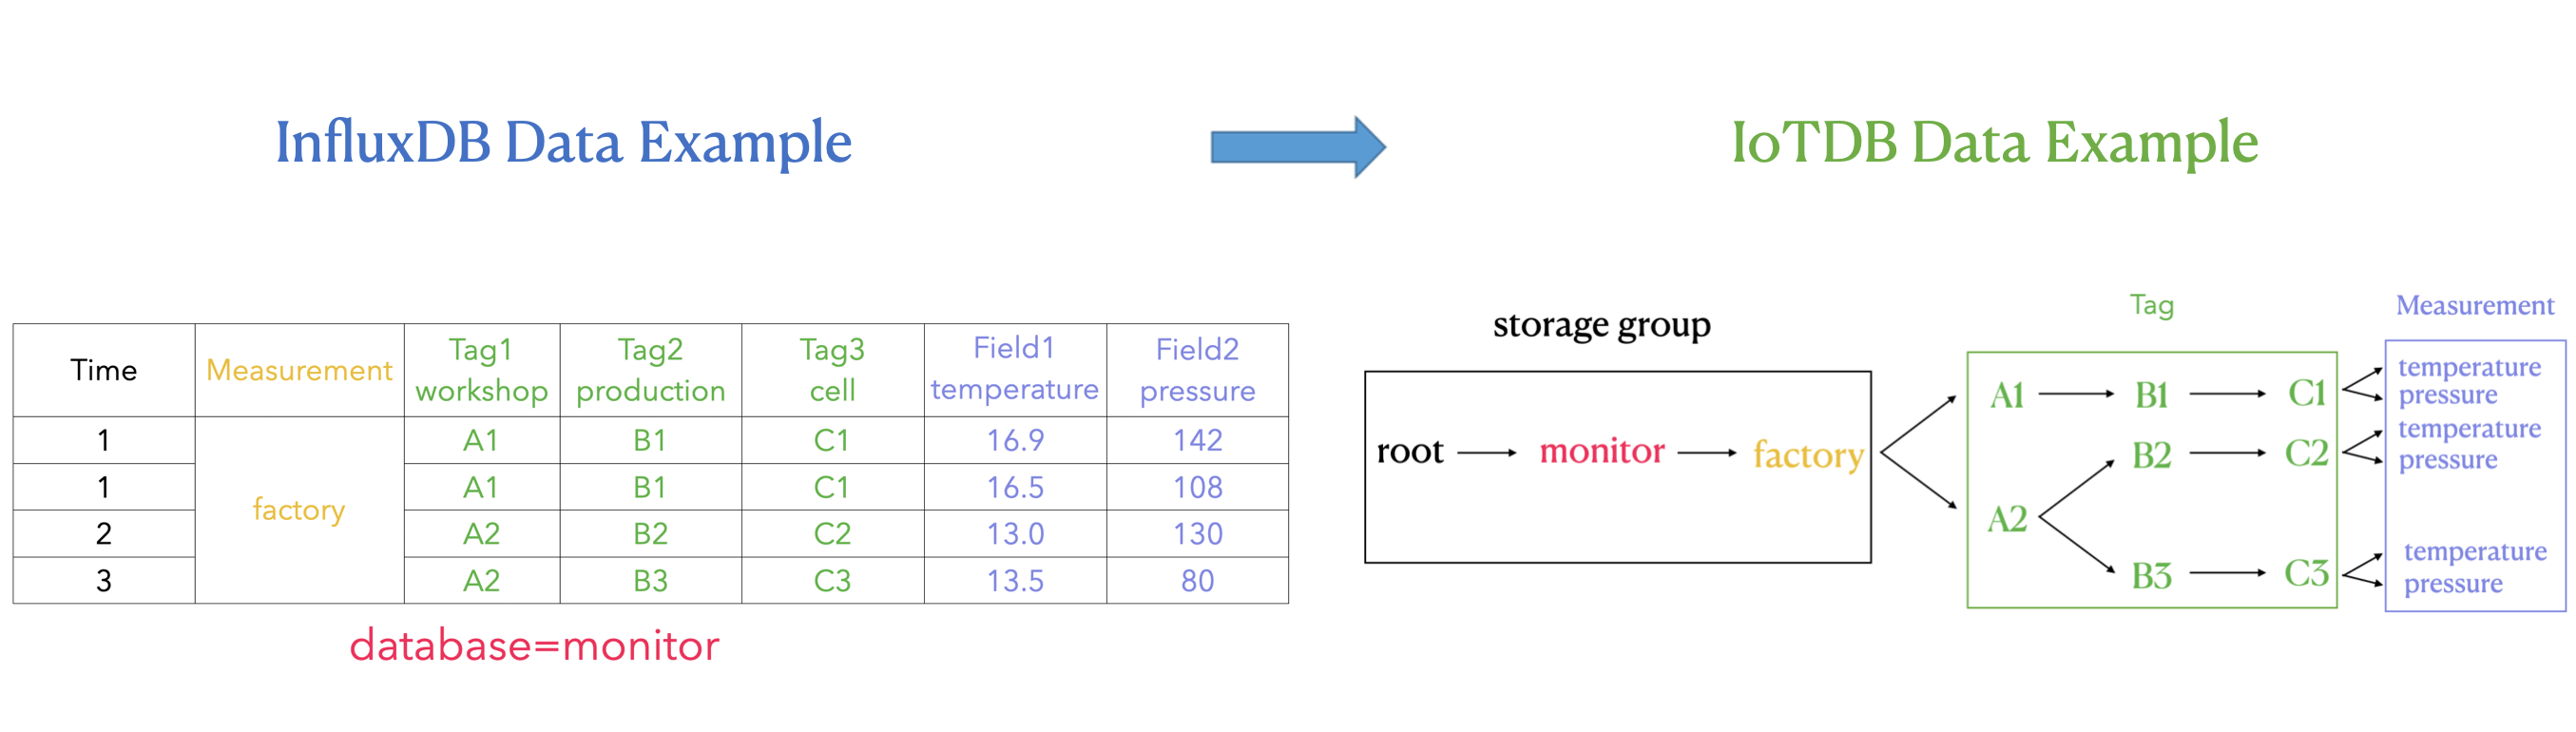
@@ -76,7 +76,7 @@ InfluxDB 元数据向 IoTDB 元数据的转换关系可以由下面的公示表
`root.{database}.{measurement}.{tag value 1}.{tag value 2}...{tag value N-1}.{tag value N}.{field key}`
-
+
如上图所示,可以看出:
diff --git a/docs/zh/UserGuide/API/Programming-Go-Native-API.md b/docs/zh/UserGuide/API/Programming-Go-Native-API.md
index 82de568eac..1fa5423d03 100644
--- a/docs/zh/UserGuide/API/Programming-Go-Native-API.md
+++ b/docs/zh/UserGuide/API/Programming-Go-Native-API.md
@@ -81,58 +81,3 @@ go mod tidy
# 编译并运行程序
go run session_example.go
```
-
-### SessionPool
- * 通过SessionPool管理session,用户不需要考虑如何重用session
- * 当到达pool的最大值时,获取session的请求会阻塞
- * 注意:session使用完成后需要调用PutBack方法
-
-#### 创建sessionPool
-
-```golang
-
-config := &client.PoolConfig{
- Host: host,
- Port: port,
- UserName: user,
- Password: password,
-}
-sessionPool = client.NewSessionPool(config, 3, 60000, 60000, false)
-
-```
-
-#### 使用sessionPool获取session,使用完手动调用PutBack
-
-* 设置存储组
-
-```golang
-
-session, err := sessionPool.GetSession()
-defer sessionPool.PutBack(session)
-if err == nil {
- session.SetStorageGroup(sg)
-}
-
-```
-
-* 查询
-
-```golang
-
-var timeout int64 = 1000
-session, err := sessionPool.GetSession()
-defer sessionPool.PutBack(session)
-if err != nil {
- log.Print(err)
- return
-}
-sessionDataSet, err := session.ExecuteQueryStatement(sql, &timeout)
-if err == nil {
- defer sessionDataSet.Close()
- printDataSet1(sessionDataSet)
-} else {
- log.Println(err)
-}
-
-```
-
diff --git a/docs/zh/UserGuide/API/Programming-JDBC.md b/docs/zh/UserGuide/API/Programming-JDBC.md
index 6c1a531a41..b5a7bb47ca 100644
--- a/docs/zh/UserGuide/API/Programming-JDBC.md
+++ b/docs/zh/UserGuide/API/Programming-JDBC.md
@@ -56,7 +56,7 @@ mvn clean install -pl jdbc -am -Dmaven.test.skip=true
**注意:为了更快地插入,建议使用 executeBatch()**
-```Java
+```java
import java.sql.*;
import org.apache.iotdb.jdbc.IoTDBSQLException;
diff --git a/docs/zh/UserGuide/API/Programming-MQTT.md b/docs/zh/UserGuide/API/Programming-MQTT.md
index e1bf0bfab8..8db145d57e 100644
--- a/docs/zh/UserGuide/API/Programming-MQTT.md
+++ b/docs/zh/UserGuide/API/Programming-MQTT.md
@@ -30,7 +30,7 @@
IoTDB 支持 MQTT v3.1(OASIS 标准)协议。
IoTDB 服务器包括内置的 MQTT 服务,该服务允许远程设备将消息直接发送到 IoTDB 服务器。
-<img style="width:100%; max-width:800px; max-height:600px; margin-left:auto; margin-right:auto; display:block;" src="https://user-images.githubusercontent.com/6711230/78357432-0c71cf80-75e4-11ea-98aa-c43a54d469ce.png">
+<img style="width:100%; max-width:800px; max-height:600px; margin-left:auto; margin-right:auto; display:block;" src="/img/github/78357432-0c71cf80-75e4-11ea-98aa-c43a54d469ce.png">
### 内置 MQTT 服务
内置的 MQTT 服务提供了通过 MQTT 直接连接到 IoTDB 的能力。 它侦听来自 MQTT 客户端的发布消息,然后立即将数据写入存储。
@@ -56,7 +56,7 @@ MQTT 主题与 IoTDB 时间序列相对应。
}
```
-<img style="width:100%; max-width:800px; max-height:600px; margin-left:auto; margin-right:auto; display:block;" src="https://user-images.githubusercontent.com/6711230/78357469-1bf11880-75e4-11ea-978f-a53996667a0d.png">
+<img style="width:100%; max-width:800px; max-height:600px; margin-left:auto; margin-right:auto; display:block;" src="/img/github/78357469-1bf11880-75e4-11ea-978f-a53996667a0d.png">
### MQTT 配置
默认情况下,IoTDB MQTT 服务从`${IOTDB_HOME}/${IOTDB_CONF}/iotdbengine.properties`加载配置。
diff --git a/docs/zh/UserGuide/Cluster/Cluster-Setup.md b/docs/zh/UserGuide/Cluster/Cluster-Setup.md
index ddb3c13348..becbde1c06 100644
--- a/docs/zh/UserGuide/Cluster/Cluster-Setup.md
+++ b/docs/zh/UserGuide/Cluster/Cluster-Setup.md
@@ -38,7 +38,7 @@ IoTDB 支持多种安装途径。用户可以使用三种方式对 IoTDB 进行
- 使用源码:您可以从代码仓库下载源码并编译,具体编译方法见下方。
- 二进制可运行程序:请从 [下载](https://iotdb.apache.org/Download/) 页面下载最新的安装包,解压后即完成安装。
-- 使用 Docker 镜像:dockerfile 文件位于 https://github.com/apache/iotdb/blob/master/docker/src/main
+- 使用 Docker 镜像:dockerfile 文件位于 [github](https://github.com/apache/iotdb/blob/master/docker/src/main)
#### 源码编译
diff --git a/docs/zh/UserGuide/Data-Concept/Data-Model-and-Terminology.md b/docs/zh/UserGuide/Data-Concept/Data-Model-and-Terminology.md
index 88b5a6f053..c3f7379807 100644
--- a/docs/zh/UserGuide/Data-Concept/Data-Model-and-Terminology.md
+++ b/docs/zh/UserGuide/Data-Concept/Data-Model-and-Terminology.md
@@ -25,7 +25,7 @@
根据企业组织结构和设备实体层次结构,我们将其物联网数据模型表示为如下图所示的属性层级组织结构,即电力集团层-风电场层-实体层-物理量层。其中 ROOT 为根节点,物理量层的每一个节点为叶子节点。IoTDB 采用树形结构定义数据模式,以从 ROOT 节点到叶子节点的路径来命名一个时间序列,层次间以“.”连接。例如,下图最左侧路径对应的时间序列名称为`ROOT.ln.wf01.wt01.status`。
-<img style="width:100%; max-width:800px; max-height:600px; margin-left:auto; margin-right:auto; display:block;" src="https://user-images.githubusercontent.com/19167280/123542457-5f511d00-d77c-11eb-8006-562d83069baa.png">
+<img style="width:100%; max-width:800px; max-height:600px; margin-left:auto; margin-right:auto; display:block;" src="/img/github/123542457-5f511d00-d77c-11eb-8006-562d83069baa.png">
在上图所描述的实际场景中,有许多实体所采集的物理量相同,即具有相同的工况名称和类型,因此,可以声明一个**元数据模板**来定义可采集的物理量集合。在实践中,元数据模板的使用可帮助减少元数据的资源占用,详细内容参见 [元数据模板文档](./Schema-Template.md)。
@@ -141,6 +141,6 @@ wildcard
插入数据时,对齐的时间序列中某列的某些行允许有空值。
-<img style="width:100%; max-width:800px; max-height:600px; margin-left:auto; margin-right:auto; display:block;" src="https://user-images.githubusercontent.com/19167280/114125919-f4850800-9929-11eb-8211-81d4c04af1ec.png">
+<img style="width:100%; max-width:800px; max-height:600px; margin-left:auto; margin-right:auto; display:block;" src="/img/github/114125919-f4850800-9929-11eb-8211-81d4c04af1ec.png">
在后续数据定义语言、数据操作语言和 Java 原生接口章节,将对涉及到对齐时间序列的各种操作进行逐一介绍。
diff --git a/docs/zh/UserGuide/Data-Concept/Schema-Template.md b/docs/zh/UserGuide/Data-Concept/Schema-Template.md
index c0add6c8b2..62b897c84b 100644
--- a/docs/zh/UserGuide/Data-Concept/Schema-Template.md
+++ b/docs/zh/UserGuide/Data-Concept/Schema-Template.md
@@ -29,7 +29,7 @@
下图展示了一个燃油车场景的数据模型,各地区的多台燃油车的速度、油量、加速度、角速度四个物理量将会被采集,显然这些燃油车实体具备相同的物理量。
-<img style="width:100%; max-width:800px; max-height:600px; margin-left:auto; margin-right:auto; display:block;" src="https://github.com/apache/iotdb-bin-resources/blob/main/docs/UserGuide/Data%20Concept/Measurement%20Template/example_without_template.png?raw=true" alt="example without template">
+<img style="width:100%; max-width:800px; max-height:600px; margin-left:auto; margin-right:auto; display:block;" src="/img/UserGuide/Data-Concept/Measurement-Template/example_without_template.png?raw=true" alt="example without template">
### 概念定义
@@ -45,7 +45,7 @@
使用元数据模板后,问题背景中示例的燃油车数据模型将会转变至下图所示的形式。所有的物理量元数据仅在模板中保存一份,所有的实体共享模板中的元数据。
-<img style="width:100%; max-width:800px; max-height:600px; margin-left:auto; margin-right:auto; display:block;" src="https://github.com/apache/iotdb-bin-resources/blob/main/docs/UserGuide/Data%20Concept/Measurement%20Template/example_with_template.png?raw=true" alt="example with template">
+<img style="width:100%; max-width:800px; max-height:600px; margin-left:auto; margin-right:auto; display:block;" src="/img/UserGuide/Data-Concept/Measurement-Template/example_with_template.png?raw=true" alt="example with template">
### 生命周期
@@ -60,7 +60,7 @@
最后需要补充的是,**对挂载模板与激活模板进行区分,是为了服务一种常见的场景**:在 Apache IoTDB 元数据模型 MTree 中,经常需要在数量众多的节点上“应用”元数据模板,而这些节点一般拥有共同的祖先节点。因此,可以在其共同祖先节点**挂载**模板,而不必对其大量的孩子节点进行挂载操作。对于需要“应用”模板的节点,则应该使用**激活模板**的操作。
-<img style="width:100%; max-width:800px; margin-left:auto; margin-right:auto; display:block;" src="https://github.com/apache/iotdb-bin-resources/blob/main/docs/UserGuide/Data%20Concept/Measurement%20Template/example_template_lifetime_zh.png?raw=true" alt="example with template">
+<img style="width:100%; max-width:800px; margin-left:auto; margin-right:auto; display:block;" src="/img/UserGuide/Data-Concept/Measurement-Template/example_template_lifetime_zh.png?raw=true" alt="example with template">
### 使用
diff --git a/docs/zh/UserGuide/Data-Concept/Time-Partition.md b/docs/zh/UserGuide/Data-Concept/Time-Partition.md
index 9965a49425..dc7eaeb6d9 100644
--- a/docs/zh/UserGuide/Data-Concept/Time-Partition.md
+++ b/docs/zh/UserGuide/Data-Concept/Time-Partition.md
@@ -49,7 +49,7 @@
开启时间分区功能,并设置 partition_interval 为 86400(一天),则数据的分布情况如下图所示:
-<img style="width:100%; max-width:800px; max-height:600px; margin-left:auto; margin-right:auto; display:block;" src="https://github.com/apache/iotdb-bin-resources/blob/main/docs/UserGuide/Data%20Concept/Time-Partition/time_partition_example.png?raw=true" alt="time partition example">
+<img style="width:100%; max-width:800px; max-height:600px; margin-left:auto; margin-right:auto; display:block;" src="/img/UserGuide/Data-Concept/Time-Partition/time_partition_example.png?raw=true" alt="time partition example">
* 插入一条时间戳为 0 的数据,计算 0 / 86400 = 0,则该数据会被存储到 0 号文件夹下的TsFile中
diff --git a/docs/zh/UserGuide/Ecosystem Integration/DBeaver.md b/docs/zh/UserGuide/Ecosystem-Integration/DBeaver.md
similarity index 59%
rename from docs/zh/UserGuide/Ecosystem Integration/DBeaver.md
rename to docs/zh/UserGuide/Ecosystem-Integration/DBeaver.md
index 26b198dd47..65cd7799a9 100644
--- a/docs/zh/UserGuide/Ecosystem Integration/DBeaver.md
+++ b/docs/zh/UserGuide/Ecosystem-Integration/DBeaver.md
@@ -46,10 +46,10 @@ DBeaver 是一个 SQL 客户端和数据库管理工具。DBeaver 可以使用 I
3. 打开 Driver Manager
- 
+ 
4. 为 IoTDB 新建一个驱动类型
- 
+ 
5. 下载[源代码](https://iotdb.apache.org/zh/Download/),解压并运行下面的命令编译 jdbc 驱动
@@ -58,15 +58,15 @@ DBeaver 是一个 SQL 客户端和数据库管理工具。DBeaver 可以使用 I
```
7. 在`jdbc/target/`下找到并添加名为`apache-iotdb-jdbc-{version}-jar-with-dependencies.jar`的库,点击 `Find Class`。
- 
+ 
8. 编辑驱动设置
- 
+ 
9. 新建 DataBase Connection, 选择 iotdb
- 
+ 
10. 编辑 JDBC 连接设置
@@ -75,12 +75,12 @@ DBeaver 是一个 SQL 客户端和数据库管理工具。DBeaver 可以使用 I
Username: root
Password: root
```
- 
+ 
11. 测试连接
- 
+ 
12. 可以开始通过 DBeaver 使用 IoTDB
- 
+ 
diff --git a/docs/zh/UserGuide/Ecosystem Integration/Flink IoTDB.md b/docs/zh/UserGuide/Ecosystem-Integration/Flink-IoTDB.md
similarity index 100%
rename from docs/zh/UserGuide/Ecosystem Integration/Flink IoTDB.md
rename to docs/zh/UserGuide/Ecosystem-Integration/Flink-IoTDB.md
diff --git a/docs/zh/UserGuide/Ecosystem Integration/Flink TsFile.md b/docs/zh/UserGuide/Ecosystem-Integration/Flink-TsFile.md
similarity index 100%
rename from docs/zh/UserGuide/Ecosystem Integration/Flink TsFile.md
rename to docs/zh/UserGuide/Ecosystem-Integration/Flink-TsFile.md
diff --git a/docs/zh/UserGuide/Ecosystem Integration/Grafana Connector.md b/docs/zh/UserGuide/Ecosystem-Integration/Grafana-Connector.md
similarity index 93%
rename from docs/zh/UserGuide/Ecosystem Integration/Grafana Connector.md
rename to docs/zh/UserGuide/Ecosystem-Integration/Grafana-Connector.md
index 3b60f231b2..c18f9d6d85 100644
--- a/docs/zh/UserGuide/Ecosystem Integration/Grafana Connector.md
+++ b/docs/zh/UserGuide/Ecosystem-Integration/Grafana-Connector.md
@@ -131,16 +131,16 @@ Grafana 以网页的 dashboard 形式为您展示数据,在使用时请您打
#### 添加 IoTDB 数据源
点击左上角的“Grafana”图标,选择`Data Source`选项,然后再点击`Add data source`。
-<img style="width:100%; max-width:800px; max-height:600px; margin-left:auto; margin-right:auto; display:block;" src="https://user-images.githubusercontent.com/13203019/51664777-2766ae00-1ff5-11e9-9d2f-7489f8ccbfc2.png">
+<img style="width:100%; max-width:800px; max-height:600px; margin-left:auto; margin-right:auto; display:block;" src="/img/github/51664777-2766ae00-1ff5-11e9-9d2f-7489f8ccbfc2.png">
在编辑数据源的时候,`Type`一栏选择`Simplejson`,`URL`一栏填写 http://\<ip\>:\<port\>,IP 为您的 IoTDB-Grafana-Connector 连接器所在的服务器 IP,Port 为运行端口(默认 8888)。之后确保 IoTDB 已经启动,点击“Save & Test”,出现“Data Source is working”提示表示配置成功。
-<img style="width:100%; max-width:800px; max-height:600px; margin-left:auto; margin-right:auto; display:block;" src="https://user-images.githubusercontent.com/13203019/51664842-554bf280-1ff5-11e9-97d2-54eebe0b2ca1.png">
+<img style="width:100%; max-width:800px; max-height:600px; margin-left:auto; margin-right:auto; display:block;" src="/img/github/51664842-554bf280-1ff5-11e9-97d2-54eebe0b2ca1.png">
#### 操作 Grafana
进入 Grafana 可视化页面后,可以选择添加时间序列,如下图。您也可以按照 Grafana 官方文档进行相应的操作,详情可参看 Grafana 官方文档:http://docs.grafana.org/guides/getting_started/。
-<img style="width:100%; max-width:800px; max-height:600px; margin-left:auto; margin-right:auto; display:block;" src="https://user-images.githubusercontent.com/13203019/51664878-6e54a380-1ff5-11e9-9718-4d0e24627fa8.png">
+<img style="width:100%; max-width:800px; max-height:600px; margin-left:auto; margin-right:auto; display:block;" src="/img/github/51664878-6e54a380-1ff5-11e9-9718-4d0e24627fa8.png">
### 配置 grafana
diff --git a/docs/zh/UserGuide/Ecosystem Integration/Grafana Plugin.md b/docs/zh/UserGuide/Ecosystem-Integration/Grafana-Plugin.md
similarity index 78%
rename from docs/zh/UserGuide/Ecosystem Integration/Grafana Plugin.md
rename to docs/zh/UserGuide/Ecosystem-Integration/Grafana-Plugin.md
index c40913c8c9..51dffabc8f 100644
--- a/docs/zh/UserGuide/Ecosystem Integration/Grafana Plugin.md
+++ b/docs/zh/UserGuide/Ecosystem-Integration/Grafana-Plugin.md
@@ -76,7 +76,7 @@ yarn build
如果编译成功,我们将看到生成的目标文件夹 `dist`,它包含了编译好的 Grafana 前端插件:
-<img style="width:100%; max-width:333px; max-height:545px; margin-left:auto; margin-right:auto; display:block;" src="https://github.com/apache/iotdb-bin-resources/blob/main/docs/UserGuide/Ecosystem%20Integration/Grafana-plugin/grafana-plugin-build.png?raw=true">
+<img style="width:100%; max-width:333px; max-height:545px; margin-left:auto; margin-right:auto; display:block;" src="/img/UserGuide/Ecosystem-Integration/Grafana-plugin/grafana-plugin-build.png?raw=true">
##### 方案二
@@ -90,7 +90,7 @@ yarn build
如果编译成功,我们将看到 `distribution/target` 路径下包含了编译好的 Grafana 前端插件:
-<img style="width:100%; max-width:333px; max-height:545px; margin-left:auto; margin-right:auto; display:block;" src="https://github.com/apache/iotdb-bin-resources/blob/main/docs/UserGuide/Ecosystem%20Integration/Grafana-plugin/distribution.png?raw=true">
+<img style="width:100%; max-width:333px; max-height:545px; margin-left:auto; margin-right:auto; display:block;" src="/img/UserGuide/Ecosystem-Integration/Grafana-plugin/distribution.png?raw=true">
@@ -168,9 +168,9 @@ Grafana 以网页的 dashboard 形式为您展示数据,在使用时请您打
点击左侧的 `设置` 图标,选择 `Data Source` 选项,然后再点击 `Add data source`。
-<img style="width:100%; max-width:800px; max-height:600px; margin-left:auto; margin-right:auto; display:block;" src="https://github.com/apache/iotdb-bin-resources/blob/main/docs/UserGuide/Ecosystem%20Integration/Grafana-plugin/datasource_1.png?raw=true">
+<img style="width:100%; max-width:800px; max-height:600px; margin-left:auto; margin-right:auto; display:block;" src="/img/UserGuide/Ecosystem-Integration/Grafana-plugin/datasource_1.png?raw=true">
-<img style="width:100%; max-width:800px; max-height:600px; margin-left:auto; margin-right:auto; display:block;" src="https://github.com/apache/iotdb-bin-resources/blob/main/docs/UserGuide/Ecosystem%20Integration/Grafana-plugin/datasource_2.png?raw=true">
+<img style="width:100%; max-width:800px; max-height:600px; margin-left:auto; margin-right:auto; display:block;" src="/img/UserGuide/Ecosystem-Integration/Grafana-plugin/datasource_2.png?raw=true">
选择 `Apache IoTDB` 数据源,`URL` 一栏填写 `http://<ip>:<port>`。
@@ -178,7 +178,7 @@ Ip 为您的 IoTDB 服务器所在的宿主机 IP,port 为 REST 服务的运
输入 IoTDB 服务器的 username 和 password,点击 `Save & Test`,出现 `Success` 则提示配置成功。
-<img style="width:100%; max-width:800px; max-height:600px; margin-left:auto; margin-right:auto; display:block;" src="https://github.com/apache/iotdb-bin-resources/blob/main/docs/UserGuide/Ecosystem%20Integration/Grafana-plugin/datasource_3.png?raw=true">
+<img style="width:100%; max-width:800px; max-height:600px; margin-left:auto; margin-right:auto; display:block;" src="/img/UserGuide/Ecosystem-Integration/Grafana-plugin/datasource_3.png?raw=true">
@@ -186,17 +186,17 @@ Ip 为您的 IoTDB 服务器所在的宿主机 IP,port 为 REST 服务的运
点击左侧的 `Dashboards` 图标,选择 `Manage`,如下图所示:
-<img style="width:100%; max-width:800px; max-height:600px; margin-left:auto; margin-right:auto; display:block;" src="https://github.com/apache/iotdb-bin-resources/blob/main/docs/UserGuide/Ecosystem%20Integration/Grafana-plugin/manage.png?raw=true">
+<img style="width:100%; max-width:800px; max-height:600px; margin-left:auto; margin-right:auto; display:block;" src="/img/UserGuide/Ecosystem-Integration/Grafana-plugin/manage.png?raw=true">
点击右上方的 `New Dashboard` 图标,选择 `Add an empty panel`,如下图所示:
-<img style="width:100%; max-width:800px; max-height:600px; margin-left:auto; margin-right:auto; display:block;" src="https://github.com/apache/iotdb-bin-resources/blob/main/docs/UserGuide/Ecosystem%20Integration/Grafana-plugin/add%20empty%20panel.png?raw=true">
+<img style="width:100%; max-width:800px; max-height:600px; margin-left:auto; margin-right:auto; display:block;" src="/img/UserGuide/Ecosystem-Integration/Grafana-plugin/add-empty-panel.png?raw=true">
在 SELECT 输入框、FROM 输入框、WHERE输入框、CONTROL输入框中输入内容,其中 WHERE 和 CONTROL 输入框为非必填。
如果一个查询涉及多个表达式,我们可以点击 SELECT 输入框右侧的 `+` 来添加 SELECT 子句中的表达式,也可以点击 FROM 输入框右侧的 `+` 来添加路径前缀,如下图所示:
-<img style="width:100%; max-width:800px; max-height:600px; margin-left:auto; margin-right:auto; display:block;" src="https://github.com/apache/iotdb-bin-resources/blob/main/docs/UserGuide/Ecosystem%20Integration/Grafana-plugin/grafana_input.png?raw=true">
+<img style="width:100%; max-width:800px; max-height:600px; margin-left:auto; margin-right:auto; display:block;" src="/img/UserGuide/Ecosystem-Integration/Grafana-plugin/grafana_input.png?raw=true">
SELECT 输入框中的内容可以是时间序列的后缀,可以是函数或自定义函数,可以是算数表达式,也可以是它们的嵌套表达式。您还可以使用 as 子句来重命名需要显示的结果序列名字。
@@ -229,19 +229,19 @@ CONTROL 输入框为非必须填写项目,填写内容应当是控制查询类
创建一个新的 Panel 后,点击右上角的设置按钮,如下图所示:
-<img style="width:100%; max-width:800px; max-height:600px; margin-left:auto; margin-right:auto; display:block;" src="https://github.com/apache/iotdb-bin-resources/blob/main/docs/UserGuide/Ecosystem%20Integration/Grafana-plugin/setconf.png?raw=true">
+<img style="width:100%; max-width:800px; max-height:600px; margin-left:auto; margin-right:auto; display:block;" src="/img/UserGuide/Ecosystem-Integration/Grafana-plugin/setconf.png?raw=true">
选择 `Variables`,点击 `Add variable` ,如下图所示:
-<img style="width:100%; max-width:800px; max-height:600px; margin-left:auto; margin-right:auto; display:block;" src="https://github.com/apache/iotdb-bin-resources/blob/main/docs/UserGuide/Ecosystem%20Integration/Grafana-plugin/addvaribles.png?raw=true">
+<img style="width:100%; max-width:800px; max-height:600px; margin-left:auto; margin-right:auto; display:block;" src="/img/UserGuide/Ecosystem-Integration/Grafana-plugin/addvaribles.png?raw=true">
输入 `Name`,`Label`,和 `Query`, 点击 `Update` 按钮,如下图所示:
-<img style="width:100%; max-width:800px; max-height:600px; margin-left:auto; margin-right:auto; display:block;" src="https://github.com/apache/iotdb-bin-resources/blob/main/docs/UserGuide/Ecosystem%20Integration/Grafana-plugin/variblesinput.png?raw=true">
+<img style="width:100%; max-width:800px; max-height:600px; margin-left:auto; margin-right:auto; display:block;" src="/img/UserGuide/Ecosystem-Integration/Grafana-plugin/variblesinput.png?raw=true">
应用 Variables,在 `grafana panel` 中输入变量点击 `save` 按钮,如下图所示
-<img style="width:100%; max-width:800px; max-height:600px; margin-left:auto; margin-right:auto; display:block;" src="https://github.com/apache/iotdb-bin-resources/blob/main/docs/UserGuide/Ecosystem%20Integration/Grafana-plugin/applyvariables.png?raw=true">
+<img style="width:100%; max-width:800px; max-height:600px; margin-left:auto; margin-right:auto; display:block;" src="/img/UserGuide/Ecosystem-Integration/Grafana-plugin/applyvariables.png?raw=true">
diff --git a/docs/zh/UserGuide/Ecosystem Integration/Hive TsFile.md b/docs/zh/UserGuide/Ecosystem-Integration/Hive-TsFile.md
similarity index 100%
rename from docs/zh/UserGuide/Ecosystem Integration/Hive TsFile.md
rename to docs/zh/UserGuide/Ecosystem-Integration/Hive-TsFile.md
diff --git a/docs/zh/UserGuide/Ecosystem Integration/MapReduce TsFile.md b/docs/zh/UserGuide/Ecosystem-Integration/MapReduce-TsFile.md
similarity index 100%
rename from docs/zh/UserGuide/Ecosystem Integration/MapReduce TsFile.md
rename to docs/zh/UserGuide/Ecosystem-Integration/MapReduce-TsFile.md
diff --git a/docs/zh/UserGuide/Ecosystem Integration/NiFi-IoTDB.md b/docs/zh/UserGuide/Ecosystem-Integration/NiFi-IoTDB.md
similarity index 100%
rename from docs/zh/UserGuide/Ecosystem Integration/NiFi-IoTDB.md
rename to docs/zh/UserGuide/Ecosystem-Integration/NiFi-IoTDB.md
diff --git a/docs/zh/UserGuide/Ecosystem Integration/Spark TsFile.md b/docs/zh/UserGuide/Ecosystem-Integration/Spark TsFile.md
similarity index 100%
rename from docs/zh/UserGuide/Ecosystem Integration/Spark TsFile.md
rename to docs/zh/UserGuide/Ecosystem-Integration/Spark TsFile.md
diff --git a/docs/zh/UserGuide/Ecosystem Integration/Spark IoTDB.md b/docs/zh/UserGuide/Ecosystem-Integration/Spark-IoTDB.md
similarity index 100%
rename from docs/zh/UserGuide/Ecosystem Integration/Spark IoTDB.md
rename to docs/zh/UserGuide/Ecosystem-Integration/Spark-IoTDB.md
diff --git a/docs/zh/UserGuide/Ecosystem Integration/Writing Data on HDFS.md b/docs/zh/UserGuide/Ecosystem-Integration/Writing-Data-on-HDFS.md
similarity index 97%
rename from docs/zh/UserGuide/Ecosystem Integration/Writing Data on HDFS.md
rename to docs/zh/UserGuide/Ecosystem-Integration/Writing-Data-on-HDFS.md
index 741a038862..8e730fed82 100644
--- a/docs/zh/UserGuide/Ecosystem Integration/Writing Data on HDFS.md
+++ b/docs/zh/UserGuide/Ecosystem-Integration/Writing-Data-on-HDFS.md
@@ -29,7 +29,7 @@
当你配置使用 HDFS 存储 TSFile 之后,你的数据文件将会被分布式存储。系统架构如下:
-<img style="width:100%; max-width:700px; max-height:600px; margin-left:auto; margin-right:auto; display:block;" src="https://user-images.githubusercontent.com/19167280/66922722-35180400-f05a-11e9-8ff0-7dd51716e4a8.png">
+<img style="width:100%; max-width:700px; max-height:600px; margin-left:auto; margin-right:auto; display:block;" src="/img/github/66922722-35180400-f05a-11e9-8ff0-7dd51716e4a8.png">
#### Config and usage
diff --git a/docs/zh/UserGuide/Ecosystem Integration/Zeppelin-IoTDB.md b/docs/zh/UserGuide/Ecosystem-Integration/Zeppelin-IoTDB.md
similarity index 92%
rename from docs/zh/UserGuide/Ecosystem Integration/Zeppelin-IoTDB.md
rename to docs/zh/UserGuide/Ecosystem-Integration/Zeppelin-IoTDB.md
index c870a9babc..a065679ccc 100644
--- a/docs/zh/UserGuide/Ecosystem Integration/Zeppelin-IoTDB.md
+++ b/docs/zh/UserGuide/Ecosystem-Integration/Zeppelin-IoTDB.md
@@ -25,7 +25,7 @@
Apache Zeppelin 是一个基于网页的交互式数据分析系统。用户可以通过 Zeppelin 连接数据源并使用 SQL、Scala 等进行交互式操作。操作可以保存为文档(类似于 Jupyter)。Zeppelin 支持多种数据源,包括 Spark、ElasticSearch、Cassandra 和 InfluxDB 等等。现在,IoTDB 已经支持使用 Zeppelin 进行操作。样例如下:
-
+
### Zeppelin-IoTDB 解释器
@@ -105,7 +105,7 @@ or
现在可以开始使用 Zeppelin 操作 IoTDB 了。
-
+
我们提供了一些简单的 SQL 来展示 Zeppelin-IoTDB 解释器的使用:
@@ -138,7 +138,7 @@ WHERE time >= 1
样例如下:
-
+
用户也可以参考 [[1]](https://zeppelin.apache.org/docs/0.9.0/usage/display_system/basic.html) 编写更丰富多彩的文档。
@@ -148,7 +148,7 @@ WHERE time >= 1
进入页面 [http://127.0.0.1:8080/#/interpreter](http://127.0.0.1:8080/#/interpreter) 并配置 IoTDB 的连接参数:
-
+
可配置参数默认值和解释如下:
diff --git a/docs/zh/UserGuide/IoTDB-Introduction/Architecture.md b/docs/zh/UserGuide/IoTDB-Introduction/Architecture.md
index 101e6ecc4d..45a1429030 100644
--- a/docs/zh/UserGuide/IoTDB-Introduction/Architecture.md
+++ b/docs/zh/UserGuide/IoTDB-Introduction/Architecture.md
@@ -25,7 +25,7 @@ IoTDB 套件由若干个组件构成,共同形成“数据收集-数据写入-
如下图展示了使用 IoTDB 套件全部组件后形成的整体应用架构。下文称所有组件形成 IoTDB 套件,而 IoTDB 特指其中的时间序列数据库组件。
-<img style="width:100%; max-width:800px; max-height:600px; margin-left:auto; margin-right:auto; display:block;" src="https://user-images.githubusercontent.com/25913899/67943956-39c1e800-fc16-11e9-8da2-a662f8246816.png">
+<img style="width:100%; max-width:800px; max-height:600px; margin-left:auto; margin-right:auto; display:block;" src="/img/github/67943956-39c1e800-fc16-11e9-8da2-a662f8246816.png">
在上图中,用户可以通过 JDBC 将来自设备上传感器采集的时序数据、服务器负载和 CPU 内存等系统状态数据、消息队列中的时序数据、应用程序的时序数据或者其他数据库中的时序数据导入到本地或者远程的 IoTDB 中。用户还可以将上述数据直接写成本地(或位于 HDFS 上)的 TsFile 文件。
diff --git a/docs/zh/UserGuide/IoTDB-Introduction/Scenario.md b/docs/zh/UserGuide/IoTDB-Introduction/Scenario.md
index f6d5c23a4c..2eda6e8990 100644
--- a/docs/zh/UserGuide/IoTDB-Introduction/Scenario.md
+++ b/docs/zh/UserGuide/IoTDB-Introduction/Scenario.md
@@ -29,11 +29,11 @@
此时可以采用 IoTDB 套件中的 TsFile 组件、TsFileSync 工具和 Hadoop/Spark 集成组件对数据进行存储:每新印刷一个芯片,就在 SPI 设备上使用 SDK 写一条数据,这些数据最终形成一个 TsFile 文件。通过 TsFileSync 工具,生成的 TsFile 文件将按一定规则(如每天)被同步到 Hadoop 数据中心,并由数据分析人员对其进行分析。
-<img style="width:100%; max-width:800px; max-height:600px; margin-left:auto; margin-right:auto; display:block;" src="https://user-images.githubusercontent.com/13203019/51579014-695ef980-1efa-11e9-8cbc-e9e7ee4fa0d8.png">
+<img style="width:100%; max-width:800px; max-height:600px; margin-left:auto; margin-right:auto; display:block;" src="/img/github/51579014-695ef980-1efa-11e9-8cbc-e9e7ee4fa0d8.png">
在场景 1 中,仅需要 TsFile、TsFileSync 部署在一台 PC 上,此外还需要部署 Hadoop/Spark 连接器用于数据中心端 Hadoop/Spark 集群的数据存储和分析。其示意图如上图所示。下图展示了此时的应用架构。
-<img style="width:100%; max-width:800px; max-height:600px; margin-left:auto; margin-right:auto; display:block;" src="https://user-images.githubusercontent.com/25913899/81768490-bf034f00-950d-11ea-9b56-fef3edca0958.png">
+<img style="width:100%; max-width:800px; max-height:600px; margin-left:auto; margin-right:auto; display:block;" src="/img/github/81768490-bf034f00-950d-11ea-9b56-fef3edca0958.png">
* 场景 2
@@ -43,11 +43,11 @@
此时可以采用 IoTDB 套件中的 IoTDB、TsFileSync 工具和 Hadoop/Spark 集成组件等。需要部署一个场控 PC 机,其上安装 IoTDB 和 TsFileSync 工具,用于支持读写数据、本地计算和分析以及上传数据到数据中心。此外还需要部署 Hadoop/Spark 连接器用于数据中心端 Hadoop/Spark 集群的数据存储和分析。如下图所示。
-<img style="width:100%; max-width:800px; max-height:600px; margin-left:auto; margin-right:auto; display:block;" src="https://user-images.githubusercontent.com/13203019/51579033-7ed42380-1efa-11e9-889f-fb4180291a9e.png">
+<img style="width:100%; max-width:800px; max-height:600px; margin-left:auto; margin-right:auto; display:block;" src="/img/github/51579033-7ed42380-1efa-11e9-889f-fb4180291a9e.png">
下图给出了此时的应用架构。
-<img style="width:100%; max-width:800px; max-height:600px; margin-left:auto; margin-right:auto; display:block;" src="https://user-images.githubusercontent.com/13203019/51579064-8f849980-1efa-11e9-8cd6-a7339cd0540f.jpg">
+<img style="width:100%; max-width:800px; max-height:600px; margin-left:auto; margin-right:auto; display:block;" src="/img/github/51579064-8f849980-1efa-11e9-8cd6-a7339cd0540f.jpg">
* 场景 3
@@ -57,11 +57,11 @@
此时,可以采用 IoTDB 套件中的 IoTDB、IoTDB-Client 工具、TsFileSync 工具和 Hadoop/Spark 集成组件等。将 IoTDB 服务器安装在工厂连接外网的服务器上,用户接收机械手传输的数据并将数据上传到数据中心。将 IoTDB-Client 工具安装在每一个连接工厂内网的机械手上,用于将传感器产生的实时数据上传到工厂内部服务器。再使用 TsFileSync 工具将原始数据上传到数据中心。此外还需要部署 Hadoop/Spark 连接器用于数据中心端 Hadoop/Spark 集群的数据存储和分析。如下图中间场景所示。
-<img style="width:100%; max-width:800px; max-height:600px; margin-left:auto; margin-right:auto; display:block;" src="https://user-images.githubusercontent.com/13203019/51579080-96aba780-1efa-11e9-87ac-940c45b19dd7.jpg">
+<img style="width:100%; max-width:800px; max-height:600px; margin-left:auto; margin-right:auto; display:block;" src="/img/github/51579080-96aba780-1efa-11e9-87ac-940c45b19dd7.jpg">
下图给出了此时的应用架构。
-<img style="width:100%; max-width:800px; max-height:600px; margin-left:auto; margin-right:auto; display:block;" src="https://user-images.githubusercontent.com/25913899/81768477-b874d780-950d-11ea-80ca-8807b9bd0970.png">
+<img style="width:100%; max-width:800px; max-height:600px; margin-left:auto; margin-right:auto; display:block;" src="/img/github/81768477-b874d780-950d-11ea-80ca-8807b9bd0970.png">
* 场景 4
@@ -73,4 +73,4 @@
此外还需要部署 Hadoop/Spark 集群用于数据中心端的数据存储和分析。如下图所示。
-<img style="width:100%; max-width:800px; max-height:600px; margin-left:auto; margin-right:auto; display:block;" src="https://user-images.githubusercontent.com/13203019/51579095-a4f9c380-1efa-11e9-9f95-17165ec55568.jpg">
+<img style="width:100%; max-width:800px; max-height:600px; margin-left:auto; margin-right:auto; display:block;" src="/img/github/51579095-a4f9c380-1efa-11e9-9f95-17165ec55568.jpg">
diff --git a/docs/zh/UserGuide/Maintenance-Tools/JMX-Tool.md b/docs/zh/UserGuide/Maintenance-Tools/JMX-Tool.md
index 193c2c5cb0..d3b7c3ef38 100644
--- a/docs/zh/UserGuide/Maintenance-Tools/JMX-Tool.md
+++ b/docs/zh/UserGuide/Maintenance-Tools/JMX-Tool.md
@@ -49,11 +49,11 @@ JMX_IP="the_real_iotdb_server_ip" # 填写实际 IoTDB 的 IP 地址
1. 确保安装 jdk 8。jdk 8 以上需要 [下载 visualvm](https://visualvm.github.io/download.html)
2. 打开 jvisualvm
3. 在左侧导航栏空白处右键 -> 添加 JMX 连接
-<img style="width:100%; max-width:300px; max-height:600px; margin-left:auto; margin-right:auto; display:block;" src="https://user-images.githubusercontent.com/19167280/81462914-5738c580-91e8-11ea-94d1-4ff6607e7e2c.png">
+<img style="width:100%; max-width:300px; max-height:600px; margin-left:auto; margin-right:auto; display:block;" src="/img/github/81462914-5738c580-91e8-11ea-94d1-4ff6607e7e2c.png">
4. 填写信息进行登录,按下图分别填写,注意需要勾选”不要求 SSL 连接”。
例如:
连接:192.168.130.15:31999
用户名:iotdb
口令:passw!d
-<img style="width:100%; max-width:300px; max-height:600px; margin-left:auto; margin-right:auto; display:block;" src="https://user-images.githubusercontent.com/19167280/81462909-53a53e80-91e8-11ea-98df-0012380da0b2.png">
+<img style="width:100%; max-width:300px; max-height:600px; margin-left:auto; margin-right:auto; display:block;" src="/img/github/81462909-53a53e80-91e8-11ea-98df-0012380da0b2.png">
diff --git a/docs/zh/UserGuide/Maintenance-Tools/Log-Tool.md b/docs/zh/UserGuide/Maintenance-Tools/Log-Tool.md
index 6da846968e..ca905e4f11 100644
--- a/docs/zh/UserGuide/Maintenance-Tools/Log-Tool.md
+++ b/docs/zh/UserGuide/Maintenance-Tools/Log-Tool.md
@@ -33,15 +33,15 @@ IoTDB 支持用户通过修改日志配置文件的方式对 IoTDB 系统日志
本节以 Jconsole 为例介绍连接 JMX 并进入动态系统日志配置模块的方法。启动 Jconsole 控制页面,在新建连接处建立与 IoTDB Server 的 JMX 连接(可以选择本地进程或给定 IoTDB 的 IP 及 PORT 进行远程连接,IoTDB 的 JMX 服务默认运行端口为 31999),如下图使用远程进程连接 Localhost 下运行在 31999 端口的 IoTDB JMX 服务。
-<img style="width:100%; max-width:800px; max-height:600px; margin-left:auto; margin-right:auto; display:block;" src="https://user-images.githubusercontent.com/13203019/51577195-f94d7500-1ef3-11e9-999a-b4f67055d80e.png">
+<img style="width:100%; max-width:800px; max-height:600px; margin-left:auto; margin-right:auto; display:block;" src="/img/github/51577195-f94d7500-1ef3-11e9-999a-b4f67055d80e.png">
连接到 JMX 后,您可以通过 MBean 选项卡找到名为`ch.qos.logback.classic`的`MBean`,如下图所示。
-<img style="width:100%; max-width:800px; max-height:600px; margin-left:auto; margin-right:auto; display:block;" src="https://user-images.githubusercontent.com/13203019/51577204-fe122900-1ef3-11e9-9e89-2eb1d46e24b8.png">
+<img style="width:100%; max-width:800px; max-height:600px; margin-left:auto; margin-right:auto; display:block;" src="/img/github/51577204-fe122900-1ef3-11e9-9e89-2eb1d46e24b8.png">
在`ch.qos.logback.classic`的 MBean 操作(Operations)选项中,可以看到当前动态系统日志配置支持的 6 种接口,您可以通过使用相应的方法,来执行相应的操作,操作页面如图。
-<img style="width:100%; max-width:800px; max-height:600px; margin-left:auto; margin-right:auto; display:block;" src="https://user-images.githubusercontent.com/13203019/51577216-09fdeb00-1ef4-11e9-9005-542ad7d9e9e0.png">
+<img style="width:100%; max-width:800px; max-height:600px; margin-left:auto; margin-right:auto; display:block;" src="/img/github/51577216-09fdeb00-1ef4-11e9-9005-542ad7d9e9e0.png">
#### 动态系统日志接口说明
diff --git a/docs/zh/UserGuide/Maintenance-Tools/Metric-Tool.md b/docs/zh/UserGuide/Maintenance-Tools/Metric-Tool.md
index 3eaaffc1b2..cef2152452 100644
--- a/docs/zh/UserGuide/Maintenance-Tools/Metric-Tool.md
+++ b/docs/zh/UserGuide/Maintenance-Tools/Metric-Tool.md
@@ -320,7 +320,7 @@ mem{name="mtree",} 1328.0
IoTDB、Prometheus、Grafana三者的关系如下图所示:
-
+
1. IoTDB在运行过程中持续收集监控指标数据。
2. Prometheus以固定的间隔(可配置)从IoTDB的HTTP接口拉取监控指标数据。
@@ -358,7 +358,7 @@ static_configs:
### 1.4.3. Apache IoTDB Dashboard
我们提供了Apache IoTDB Dashboard,在Grafana中显示的效果图如下所示:
-
+
Apache IoTDB Dashboard的获取方式:
@@ -374,7 +374,7 @@ Apache IoTDB Dashboard的获取方式:
通过使用 JConsole 工具并与 JMX 连接,您可以查看一些系统统计信息和参数。
本节描述如何使用 JConsole 的 "Mbean" 选项卡来监视 IoTDB 的一些系统配置、写入数据统计等等。 连接到 JMX 后,您可以通过 "MBeans" 标签找到名为 "org.apache.iotdb.service" 的 "MBean",如下图所示。
-<img style="width:100%; max-width:800px; max-height:600px; margin-left:auto; margin-right:auto; display:block;" src="https://user-images.githubusercontent.com/46039728/149951720-707f1ee8-32ee-4fde-9252-048caebd232e.png"> <br>
+<img style="width:100%; max-width:800px; max-height:600px; margin-left:auto; margin-right:auto; display:block;" src="/img/github/149951720-707f1ee8-32ee-4fde-9252-048caebd232e.png"> <br>
# 4. 性能监控
@@ -382,7 +382,7 @@ Apache IoTDB Dashboard的获取方式:
性能监控模块用来监控 IOTDB 每一个操作的耗时,以便用户更好的了解数据库的整体性能。此模块会统计每一种操作的平均耗时,以及耗时在一定时间区间内(1ms,4ms,16ms,64ms,256ms,1024ms,以上)的操作的比例。输出文件在 log_measure.log 中。输出样例如下:
-<img style="width:100%; max-width:800px; max-height:600px; margin-left:auto; margin-right:auto; display:block;" src="https://user-images.githubusercontent.com/13203019/60937461-14296f80-a303-11e9-9602-a7bed624bfb3.png">
+<img style="width:100%; max-width:800px; max-height:600px; margin-left:auto; margin-right:auto; display:block;" src="/img/github/60937461-14296f80-a303-11e9-9602-a7bed624bfb3.png">
## 4.2. 配置参数
@@ -403,4 +403,4 @@ Apache IoTDB Dashboard的获取方式:
1. 通过端口 31999 连接 jconsole,并在上方菜单项中选择‘MBean’.
2. 展开侧边框并选择 'org.apache.iotdb.db.service'. 将会得到如下图所示结果:
-<img style="width:100%; max-width:800px; max-height:600px; margin-left:auto; margin-right:auto; display:block;" src="https://user-images.githubusercontent.com/19167280/112426760-73e3da80-8d73-11eb-9a8f-9232d1f2033b.png">
\ No newline at end of file
+<img style="width:100%; max-width:800px; max-height:600px; margin-left:auto; margin-right:auto; display:block;" src="/img/github/112426760-73e3da80-8d73-11eb-9a8f-9232d1f2033b.png">
\ No newline at end of file
diff --git a/docs/zh/UserGuide/Operate-Metadata/Auto-Create-MetaData.md b/docs/zh/UserGuide/Operate-Metadata/Auto-Create-MetaData.md
index 609f59b108..8e05236c0a 100644
--- a/docs/zh/UserGuide/Operate-Metadata/Auto-Create-MetaData.md
+++ b/docs/zh/UserGuide/Operate-Metadata/Auto-Create-MetaData.md
@@ -50,7 +50,7 @@
* 当 default_storage_group_level=2 时,将使用 root.turbine1.d1、root.turbine1.d2、root.turbine2.d1 和 root.turbine2.d2 作为存储组。
-<img style="width:100%; max-width:800px; max-height:600px; margin-left:auto; margin-right:auto; display:block;" src="https://github.com/apache/iotdb-bin-resources/blob/main/docs/UserGuide/Data%20Concept/Auto-Create-MetaData/auto_create_sg_example.png?raw=true" alt="auto create storage group example">
+<img style="width:100%; max-width:800px; max-height:600px; margin-left:auto; margin-right:auto; display:block;" src="/img/UserGuide/Data-Concept/Auto-Create-MetaData/auto_create_sg_example.png?raw=true" alt="auto create storage group example">
### 自动创建序列的元数据(前端指定数据类型)
diff --git a/docs/zh/UserGuide/Operate-Metadata/Timeseries.md b/docs/zh/UserGuide/Operate-Metadata/Timeseries.md
index dc790df3ad..8c7d3734af 100644
--- a/docs/zh/UserGuide/Operate-Metadata/Timeseries.md
+++ b/docs/zh/UserGuide/Operate-Metadata/Timeseries.md
@@ -175,7 +175,7 @@ It costs 0.004s
那么 Metadata Tree 如下所示:
-<img style="width:100%; max-width:600px; margin-left:auto; margin-right:auto; display:block;" src="https://user-images.githubusercontent.com/19167280/69792176-1718f400-1201-11ea-861a-1a83c07ca144.jpg">
+<img style="width:100%; max-width:600px; margin-left:auto; margin-right:auto; display:block;" src="/img/github/69792176-1718f400-1201-11ea-861a-1a83c07ca144.jpg">
可以看到,`root`被定义为`LEVEL=0`。那么当你输入如下语句时:
@@ -238,7 +238,7 @@ create timeseries root.turbine.d1.s1(temprature) with datatype=FLOAT, encoding=R
括号里的`temprature`是`s1`这个传感器的别名。
我们可以在任何用到`s1`的地方,将其用`temprature`代替,这两者是等价的。
-> IoTDB 同时支持在查询语句中 [使用 AS 函数](../Reference/DML-Data-Manipulation%20Language.md) 设置别名。二者的区别在于:AS 函数设置的别名用于替代整条时间序列名,且是临时的,不与时间序列绑定;而上文中的别名只作为传感器的别名,与其绑定且可与原传感器名等价使用。
+> IoTDB 同时支持在查询语句中 [使用 AS 函数](../Query-Data/Select-Expression.html#使用别名) 设置别名。二者的区别在于:AS 函数设置的别名用于替代整条时间序列名,且是临时的,不与时间序列绑定;而上文中的别名只作为传感器的别名,与其绑定且可与原传感器名等价使用。
> 注意:额外的标签和属性信息总的大小不能超过`tag_attribute_total_size`.
diff --git a/docs/zh/UserGuide/Process-Data/Alerting.md b/docs/zh/UserGuide/Process-Data/Alerting.md
index 2ee3953c69..8b263772f7 100644
--- a/docs/zh/UserGuide/Process-Data/Alerting.md
+++ b/docs/zh/UserGuide/Process-Data/Alerting.md
@@ -371,4 +371,4 @@ INSERT INTO root.ln.wf01.wt01(timestamp, temperature) VALUES (5, 120);
会抑制 `severity` 为 `warning` 的告警,我们收到的告警邮件中只包含写入
`(5, 120)` 后触发的告警。
-<img alt="alerting" src="https://user-images.githubusercontent.com/34649843/115957896-a9791080-a537-11eb-9962-541412bdcee6.png">
+<img alt="alerting" src="/img/github/115957896-a9791080-a537-11eb-9962-541412bdcee6.png">
diff --git a/docs/zh/UserGuide/Process-Data/Continuous-Query.md b/docs/zh/UserGuide/Process-Data/Continuous-Query.md
index a59e224162..91c91e20fc 100644
--- a/docs/zh/UserGuide/Process-Data/Continuous-Query.md
+++ b/docs/zh/UserGuide/Process-Data/Continuous-Query.md
@@ -60,7 +60,7 @@ END
* `<path_prefix>` 与 `<path_suffix>` 拼接成完整的查询原时间序列。
* `<full_path>` 或 `<node_name>` 指定将查询出的数据写入的结果序列路径。
* `<group_by_interval>` 指定时间分组长度,支持 ns、us、ms、s、m、h、d、w、mo、y 等单位。
-* `<level>`指按照序列第 `<level>` 层分组,将第 `<level>` 层同名的所有序列聚合。Group By Level 语句的具体语义及 `<level>` 的定义见 [路径层级分组聚合](../Operate-Metadata/DML-Data-Manipulation-Language.md)。
+* `<level>`指按照序列第 `<level>` 层分组,将第 `<level>` 层同名的所有序列聚合。Group By Level 语句的具体语义及 `<level>` 的定义见 [路径层级分组聚合](../Query-Data/Aggregate-Query.html#聚合查询)。
注:
diff --git a/docs/zh/UserGuide/Process-Data/Triggers.md b/docs/zh/UserGuide/Process-Data/Triggers.md
index 561bed99a5..0bf1713908 100644
--- a/docs/zh/UserGuide/Process-Data/Triggers.md
+++ b/docs/zh/UserGuide/Process-Data/Triggers.md
@@ -274,7 +274,7 @@ SHOW TRIGGERS
* `START_TRIGGER`:具备该权限的用户才被允许启动已被停止的触发器。该权限需要与触发器的路径绑定。
* `STOP_TRIGGER`:具备该权限的用户才被允许停止正在运行的触发器。该权限需要与触发器的路径绑定。
-更多用户权限相关的内容,请参考 [权限管理语句](../Operation%20Manual/Administration.md)。
+更多用户权限相关的内容,请参考 [权限管理语句](../Administration-Management/Administration.md)。
### 实用工具类
diff --git a/docs/zh/UserGuide/Process-Data/UDF-User-Defined-Function.md b/docs/zh/UserGuide/Process-Data/UDF-User-Defined-Function.md
index a39e0a1376..43935b1c51 100644
--- a/docs/zh/UserGuide/Process-Data/UDF-User-Defined-Function.md
+++ b/docs/zh/UserGuide/Process-Data/UDF-User-Defined-Function.md
@@ -166,7 +166,7 @@ void beforeStart(UDFParameters parameters, UDTFConfigurations configurations) th
3 类参数的关系可见下图。策略的构造方法详见 Javadoc。
-<img style="width:100%; max-width:800px; max-height:600px; margin-left:auto; margin-right:auto; display:block;" src="https://user-images.githubusercontent.com/30497621/99787878-47b51480-2b5b-11eb-8ed3-84088c5c30f7.png">
+<img style="width:100%; max-width:800px; max-height:600px; margin-left:auto; margin-right:auto; display:block;" src="/img/github/99787878-47b51480-2b5b-11eb-8ed3-84088c5c30f7.png">
注意,最后的一些时间窗口的实际时间间隔可能小于规定的时间间隔参数。另外,可能存在某些时间窗口内数据行数量为 0 的情况,这种情况框架也会为该窗口调用一次`transform`方法。
diff --git a/docs/zh/UserGuide/Query-Data/Aggregate-Query.md b/docs/zh/UserGuide/Query-Data/Aggregate-Query.md
index 6e9a0540e6..165cfcb76d 100644
--- a/docs/zh/UserGuide/Query-Data/Aggregate-Query.md
+++ b/docs/zh/UserGuide/Query-Data/Aggregate-Query.md
@@ -178,7 +178,7 @@ GROUP BY 语句为用户提供三类指定参数:
三类参数的实际含义已经在下图中指出,这三类参数里,第三个参数是可选的。
-<img style="width:100%; max-width:800px; max-height:600px; margin-left:auto; margin-right:auto; display:block;" src="https://user-images.githubusercontent.com/16079446/69109512-f808bc80-0ab2-11ea-9e4d-b2b2f58fb474.png">
+<img style="width:100%; max-width:800px; max-height:600px; margin-left:auto; margin-right:auto; display:block;" src="/img/github/69109512-f808bc80-0ab2-11ea-9e4d-b2b2f58fb474.png">
接下来,我们将给出三种典型的降频聚合查询的例子:
diff --git a/docs/zh/UserGuide/Query-Data/Select-Expression.md b/docs/zh/UserGuide/Query-Data/Select-Expression.md
index c6e55678ae..8855e07abc 100644
--- a/docs/zh/UserGuide/Query-Data/Select-Expression.md
+++ b/docs/zh/UserGuide/Query-Data/Select-Expression.md
@@ -477,10 +477,10 @@ IoTDB> select ts, in_range(ts, 'lower'='2', 'upper'='3.1') from root.test;
| 函数名 | 输入序列类型 | 属性参数 | 输出序列类型 | 功能描述 |
|-------------------|--------------------------------------|------------------------------------------------|-------|------------------------------------------------------------------|
-| ZERO_DURATION | INT32/ INT64/ FLOAT/ DOUBLE/ BOOLEAN | `min`:可选,默认值0</br>`max`:可选,默认值`Long.MAX_VALUE` | Long | 返回时间序列连续为0(false)的开始时间与持续时间,持续时间t(单位ms)满足`t >= min && t <= max` |
-| NON_ZERO_DURATION | INT32/ INT64/ FLOAT/ DOUBLE/ BOOLEAN | `min`:可选,默认值0</br>`max`:可选,默认值`Long.MAX_VALUE` | Long | 返回时间序列连续不为0(false)的开始时间与持续时间,持续时间t(单位ms)满足`t >= min && t <= max` | |
-| ZERO_COUNT | INT32/ INT64/ FLOAT/ DOUBLE/ BOOLEAN | `min`:可选,默认值1</br>`max`:可选,默认值`Long.MAX_VALUE` | Long | 返回时间序列连续为0(false)的开始时间与其后数据点的个数,数据点个数n满足`n >= min && n <= max` | |
-| NON_ZERO_COUNT | INT32/ INT64/ FLOAT/ DOUBLE/ BOOLEAN | `min`:可选,默认值1</br>`max`:可选,默认值`Long.MAX_VALUE` | Long | 返回时间序列连续不为0(false)的开始时间与其后数据点的个数,数据点个数n满足`n >= min && n <= max` | |
+| ZERO_DURATION | INT32/ INT64/ FLOAT/ DOUBLE/ BOOLEAN | `min`:可选,默认值0<br>`max`:可选,默认值`Long.MAX_VALUE` | Long | 返回时间序列连续为0(false)的开始时间与持续时间,持续时间t(单位ms)满足`t >= min && t <= max` |
+| NON_ZERO_DURATION | INT32/ INT64/ FLOAT/ DOUBLE/ BOOLEAN | `min`:可选,默认值0<br>`max`:可选,默认值`Long.MAX_VALUE` | Long | 返回时间序列连续不为0(false)的开始时间与持续时间,持续时间t(单位ms)满足`t >= min && t <= max` | |
+| ZERO_COUNT | INT32/ INT64/ FLOAT/ DOUBLE/ BOOLEAN | `min`:可选,默认值1<br>`max`:可选,默认值`Long.MAX_VALUE` | Long | 返回时间序列连续为0(false)的开始时间与其后数据点的个数,数据点个数n满足`n >= min && n <= max` | |
+| NON_ZERO_COUNT | INT32/ INT64/ FLOAT/ DOUBLE/ BOOLEAN | `min`:可选,默认值1<br>`max`:可选,默认值`Long.MAX_VALUE` | Long | 返回时间序列连续不为0(false)的开始时间与其后数据点的个数,数据点个数n满足`n >= min && n <= max` | |
##### 演示
测试数据:
@@ -768,7 +768,7 @@ It costs 0.012s
>
> 即不支持以下查询
>
-> ```SQL
+> ```sql
> SELECT avg(s1 + 1) FROM root.sg.d1; -- 聚合函数内部有表达式
> SELECT avg(s1) + avg(s2) FROM root.sg.* GROUP BY LEVEL=1; -- 按层级聚合
> SELECT avg(s1) + avg(s2) FROM root.sg.d1 GROUP BY([0, 10000), 1s) FILL(previous); -- 空值填充
diff --git a/docs/zh/UserGuide/QuickStart/Command-Line-Interface.md b/docs/zh/UserGuide/QuickStart/Command-Line-Interface.md
index 0c2a007bdd..fa775bbcf9 100644
--- a/docs/zh/UserGuide/QuickStart/Command-Line-Interface.md
+++ b/docs/zh/UserGuide/QuickStart/Command-Line-Interface.md
@@ -36,7 +36,7 @@ IOTDB 为用户提供 cli/Shell 工具用于启动客户端和服务端程序。
### 运行
#### Cli 运行方式
-安装后的 IoTDB 中有一个默认用户:`root`,默认密码为`root`。用户可以使用该用户尝试运行 IoTDB 客户端以测试服务器是否正常启动。客户端启动脚本为$IOTDB_HOME/sbin 文件夹下的`start-cli`脚本。启动脚本时需要指定运行 IP 和 RPC PORT。以下为服务器在本机启动,且用户未更改运行端口号的示例,默认端口为 6667。若用户尝试连接远程服务器或更改了服务器运行的端口号,请在-h 和-p 项处使用服务器的 IP 和 RPC PORT。</br>
+安装后的 IoTDB 中有一个默认用户:`root`,默认密码为`root`。用户可以使用该用户尝试运行 IoTDB 客户端以测试服务器是否正常启动。客户端启动脚本为$IOTDB_HOME/sbin 文件夹下的`start-cli`脚本。启动脚本时需要指定运行 IP 和 RPC PORT。以下为服务器在本机启动,且用户未更改运行端口号的示例,默认端口为 6667。若用户尝试连接远程服务器或更改了服务器运行的端口号,请在-h 和-p 项处使用服务器的 IP 和 RPC PORT。<br>
用户也可以在启动脚本的最前方设置自己的环境变量,如 JAVA_HOME 等 (对于 linux 用户,脚本路径为:"/sbin/start-cli.sh"; 对于 windows 用户,脚本路径为:"/sbin/start-cli.bat")
Linux 系统与 MacOS 系统启动命令如下:
@@ -116,49 +116,49 @@ Shell >./standalone.sh
```
2、使用 https://ip:port/auth 登陆 keycloack, 首次登陆需要创建用户
-
+
3、点击 Administration Console 进入管理端
-
+
4、在左侧的 Master 菜单点击 add Realm, 输入 Name 创建一个新的 Realm
-
+
-
+
5、点击左侧菜单 Clients,创建 client
-
+
6、点击左侧菜单 User,创建 user
-
+
7、点击新创建的用户 id,点击 Credentials 导航输入密码和关闭 Temporary 选项,至此 keyclork 配置完成
-
+
8、创建角色,点击左侧菜单的 Roles然后点击Add Role 按钮添加角色
-
+
9、在Role Name 中输入`iotdb_admin`,点击save 按钮。提示:这里的`iotdb_admin`不能为其他名称否则即使登陆成功后也将无权限使用iotdb的查询、插入、创建存储组、添加用户、角色等功能
-
+
10、点击左侧的User 菜单然后点击用户列表中的Edit的按钮为该用户添加我们刚创建的`iotdb_admin`角色
-
+
11、选择Role Mappings ,在Available Role选择`iotdb_admin`角色然后点Add selected 按钮添加角色
-
+
12、如果`iotdb_admin`角色在Assigned Roles中并且出现`Success Role mappings updated`提示,证明角色添加成功
-
+
提示:如果用户角色有调整需要重新生成token并且重新登陆iotdb才会生效
diff --git a/docs/zh/UserGuide/QuickStart/QuickStart.md b/docs/zh/UserGuide/QuickStart/QuickStart.md
index 3fd7793861..cef15c32ed 100644
--- a/docs/zh/UserGuide/QuickStart/QuickStart.md
+++ b/docs/zh/UserGuide/QuickStart/QuickStart.md
@@ -37,7 +37,7 @@ IoTDB 支持多种安装途径。用户可以使用三种方式对 IoTDB 进行
* 二进制可运行程序:请从 [下载](https://iotdb.apache.org/Download/) 页面下载最新的安装包,解压后即完成安装。
-* 使用 Docker 镜像:dockerfile 文件位于 https://github.com/apache/iotdb/blob/master/docker/src/main
+* 使用 Docker 镜像:dockerfile 文件位于 [github](https://github.com/apache/iotdb/blob/master/docker/src/main)
### 软件目录结构
diff --git a/docs/zh/UserGuide/Reference/SQL-Reference.md b/docs/zh/UserGuide/Reference/SQL-Reference.md
index 7d5f4173ae..eeeaa0f818 100644
--- a/docs/zh/UserGuide/Reference/SQL-Reference.md
+++ b/docs/zh/UserGuide/Reference/SQL-Reference.md
@@ -1202,7 +1202,7 @@ Note: DateTime Type can support several types, see Chapter 3 Datetime section fo
```
PrecedenceEqualOperator : EQUAL | NOTEQUAL | LESSTHANOREQUALTO | LESSTHAN | GREATERTHANOREQUALTO | GREATERTHAN
```
-Timeseries : ROOT [DOT <LayerName>]* DOT <SensorName>
+Timeseries : ROOT [DOT \<LayerName\>]* DOT \<SensorName\>
LayerName : Identifier
SensorName : Identifier
eg. root.ln.wf01.wt01.status
@@ -1211,7 +1211,7 @@ Note: Timeseries must be start with `root`(case insensitive) and end with sensor
```
```
-PrefixPath : ROOT (DOT <LayerName>)*
+PrefixPath : ROOT (DOT \<LayerName\>)*
LayerName : Identifier | STAR
eg. root.sgcc
eg. root.*
diff --git a/docs/zh/UserGuide/Reference/TSDB-Comparison.md b/docs/zh/UserGuide/Reference/TSDB-Comparison.md
index aee3581336..efd17378fc 100644
--- a/docs/zh/UserGuide/Reference/TSDB-Comparison.md
+++ b/docs/zh/UserGuide/Reference/TSDB-Comparison.md
@@ -23,7 +23,7 @@
### Overview
-
+
**表格外观启发自 [Andriy Zabavskyy: How to Select Time Series DB](https://towardsdatascience.com/how-to-select-time-series-db-123b0eb4ab82)*
@@ -285,7 +285,7 @@ IoTDB 拥有许多其它时间序列数据库不支持的强大功能。
写入吞吐率(points/second)如下图所示:
-<img src="https://user-images.githubusercontent.com/24886743/106254214-6cacbe80-6253-11eb-8532-d6a1829f8f66.png" alt="Batch Size with Write Throughput (points/second)" />
+<img src="/img/github/106254214-6cacbe80-6253-11eb-8532-d6a1829f8f66.png" alt="Batch Size with Write Throughput (points/second)" />
<center>Figure 1. Batch Size with Write throughput (points/second) IoTDB v0.11.1</center>
@@ -295,7 +295,7 @@ client num 从 1 到 50 变化。IoTDB 使用 batch insertion API,batch size
写入吞吐率(points/second)如下图所示:
-
+
<center>Figure 3. Client Num with Write Throughput (points/second) IoTDB v0.11.1</center>
@@ -309,19 +309,19 @@ client num 从 1 到 50 变化。IoTDB 使用 batch insertion API,batch size
测试结果如下图所示:
-
+
<center>Figure 4. Raw data query 1 col time cost(ms) IoTDB v0.11.1</center>
-
+
<center>Figure 5. Aggregation query time cost(ms) IoTDB v0.11.1</center>
-
+
<center>Figure 6. Downsampling query time cost(ms) IoTDB v0.11.1</center>
-
+
<center>Figure 7. Latest query time cost(ms) IoTDB v0.11.1</center>
diff --git a/docs/zh/UserGuide/UserGuideReadme.md b/docs/zh/UserGuide/UserGuideReadme.md
index 5282fe926d..739e32ae41 100644
--- a/docs/zh/UserGuide/UserGuideReadme.md
+++ b/docs/zh/UserGuide/UserGuideReadme.md
@@ -25,7 +25,6 @@
"In Progress Version" 用于匹配 IOTDB 源代码存储库的 master 分支。
其他文档用于匹配 IoTDB 发布的版本。
-- [In progress version](https://iotdb.apache.org/UserGuide/Master/Get%20Started/QuickStart.html)
-- [Version 0.10.x](https://iotdb.apache.org/UserGuide/V0.10.x/Get%20Started/QuickStart.html)
-- [Version 0.9.x](https://iotdb.apache.org/UserGuide/V0.9.x/0-Get%20Started/1-QuickStart.html)
-- [Version 0.8.x](https://iotdb.apache.org/UserGuide/V0.8.x/0-Get%20Started/1-QuickStart.html)
+- [In progress version](https://iotdb.apache.org/UserGuide/Master/QuickStart/QuickStart.html)
+- [Version 1.0.x](https://iotdb.apache.org/UserGuide/V1.0.x/QuickStart/QuickStart.html)
+- [Version 0.13.x](https://iotdb.apache.org/UserGuide/V0.13.x/QuickStart/QuickStart.html)