You are viewing a plain text version of this content. The canonical link for it is here.
Posted to commits@echarts.apache.org by GitBox <gi...@apache.org> on 2019/11/10 10:22:54 UTC
[GitHub] [incubator-echarts] szkissyh opened a new issue #11614: svg模式 地理位置绘制无渐变效果
szkissyh opened a new issue #11614: svg模式 地理位置绘制无渐变效果
URL: https://github.com/apache/incubator-echarts/issues/11614
### Version
4.4.0
### Steps to reproduce
1、将 charts设置为svg模式
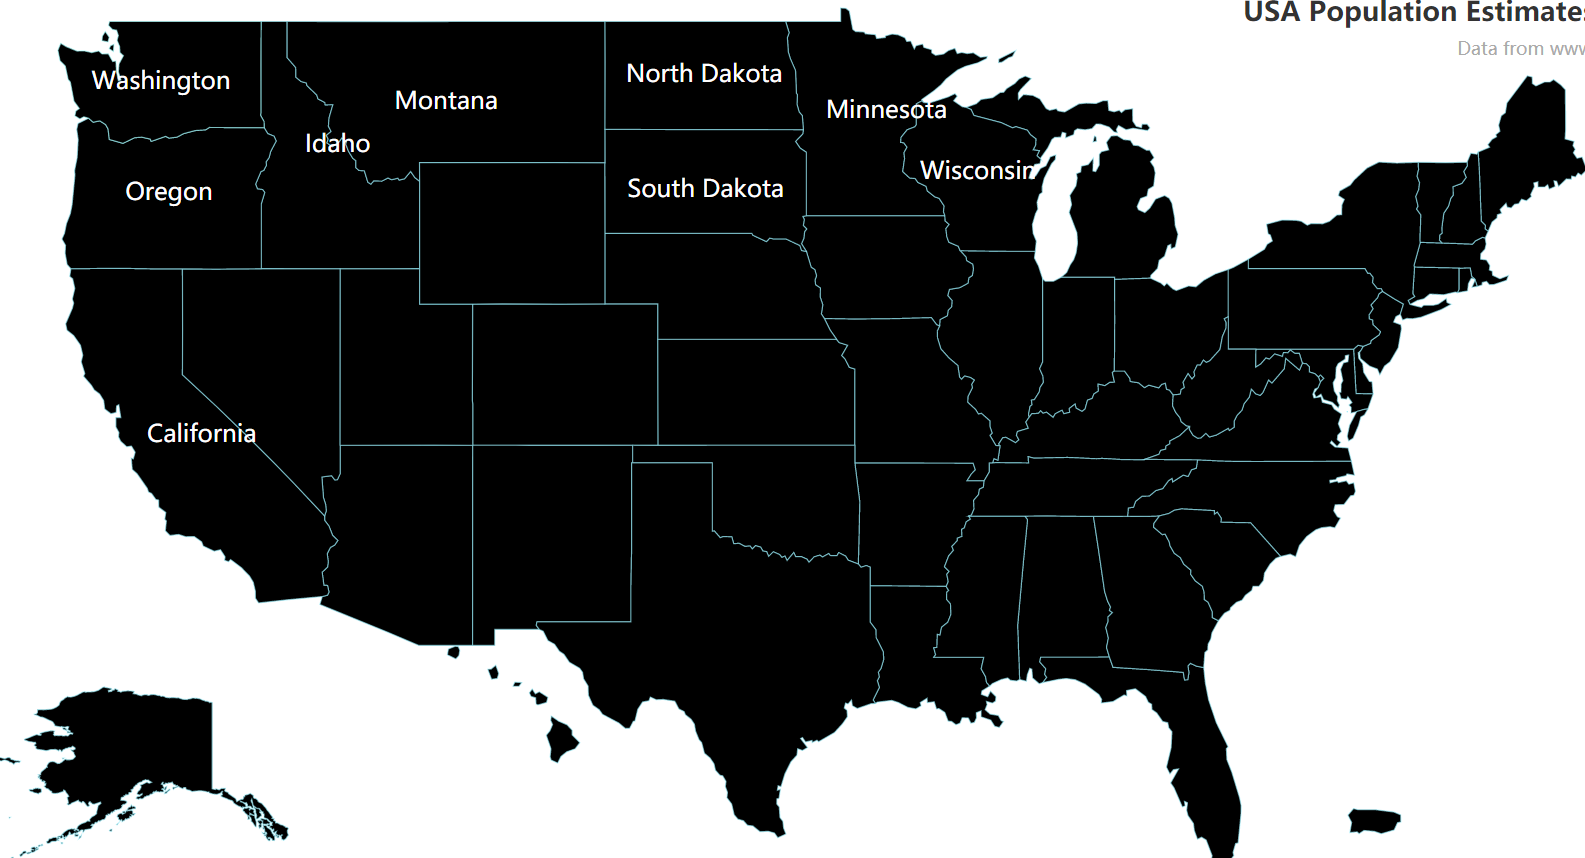
2、地图无渐变效果
canas效果

svg效果
样例代码:
geo: {
name: 'USA PopEstimates',
type: 'map',
roam: true,
map: 'USA',
layoutSize: 100,
zoom: 1.2,//地图放大1.2倍
label: {
emphasis: {
show: true,
color: '#fffefe',
formatter:function(data){
return nationCE[data.name]
}
}
},
itemStyle: {
normal: {
borderColor: 'rgba(147, 235, 248, 0.6)',
borderWidth: 0.8,
areaColor: {
type: 'linear-gradient',
x: 0,
y: 30,
x2: 7,
y2: 0,
colorStops: [{
offset: 0,
color: '#00befc' // 0% 处的颜色 #009DA1
}, {
offset: 1,
color: '#083fb5' // 50% 处的颜色 #005B9E
}],
global: true // 缺省为 false
},
},
emphasis: {
areaColor: {
type: 'linear-gradient',
x: 0,
y: 30,
x2: 7,
y2: 0,
colorStops: [{
offset: 0,
color: '#6AFFEC' // 0% 处的颜色 #009DA1
}, {
offset: 1,
color: '#47C5FF' // 50% 处的颜色 #005B9E
}],
global: true // 缺省为 false
},
}
},
### What is expected?
和canvas模式一样,能正确地图渐变效果
### What is actually happening?
svg模式和canvas模式行为不一样
<!-- This issue is generated by echarts-issue-helper. DO NOT REMOVE -->
<!-- This issue is in English. DO NOT REMOVE -->
----------------------------------------------------------------
This is an automated message from the Apache Git Service.
To respond to the message, please log on to GitHub and use the
URL above to go to the specific comment.
For queries about this service, please contact Infrastructure at:
users@infra.apache.org
With regards,
Apache Git Services
---------------------------------------------------------------------
To unsubscribe, e-mail: commits-unsubscribe@echarts.apache.org
For additional commands, e-mail: commits-help@echarts.apache.org