You are viewing a plain text version of this content. The canonical link for it is here.
Posted to notifications@apisix.apache.org by GitBox <gi...@apache.org> on 2021/11/30 08:51:28 UTC
[GitHub] [apisix-website] yzeng25 commented on a change in pull request #781: docs: add APISIX Ingress in KubeSphere tech blog
yzeng25 commented on a change in pull request #781:
URL: https://github.com/apache/apisix-website/pull/781#discussion_r759046289
##########
File path: website/blog/2021/11/30/use-ingress-in-kubesphere.md
##########
@@ -0,0 +1,439 @@
+---
+title: "Using Apache APISIX Ingress Gateway to access Custom Monitoring in KubeSphere"
+author: "Haili Zhang"
+authorURL: "https://github.com/webup"
+authorImageURL: "https://avatars.githubusercontent.com/u/2936504?v=4"
+keywords:
+- KubeSphere
+- Apache APISIX
+- Kubenetes
+- Ingress Controller
+- Monitor
+description: This article will take Apache APISIX Ingress Controller as an example to show you in detail how to quickly use different types of gateways and status monitoring for Kubernetes clusters through KubeSphere.
+tags: [Technology]
+---
+
+> This article will take Apache APISIX Ingress Controller as an example to show you in detail how to quickly use different types of gateways and status monitoring for Kubernetes clusters through KubeSphere.
+
+<!--truncate-->
+
+In early November, KubeSphere released version 3.2.0, which added a full set of monitoring and management pages for project gateways, and introduced cluster gateways to provide global Ingress gateway capabilities at the cluster level.
+
+To help users better understand how to deploy and use third-party Ingress Controllers in the new version of KubeSphere, this article will use the [Apache APISIX Ingress Controller](https://apisix.apache.org/docs/ingress-controller/getting-started/) as an example to show you how to quickly use different types of gateways for Kubernetes clusters with KubeSphere and perform status monitoring.
+
+## Preparation
+
+### Installing KubeSphere
+
+There are two ways to install KubeSphere.
+
+1. Install directly on [Linux](https://kubesphere.com.cn/docs/quick-start/all-in-one-on-linux/)
+2. Install on [existing Kubernetes](https://kubesphere.com.cn/docs/quick-start/minimal-kubesphere-on-k8s/)
+
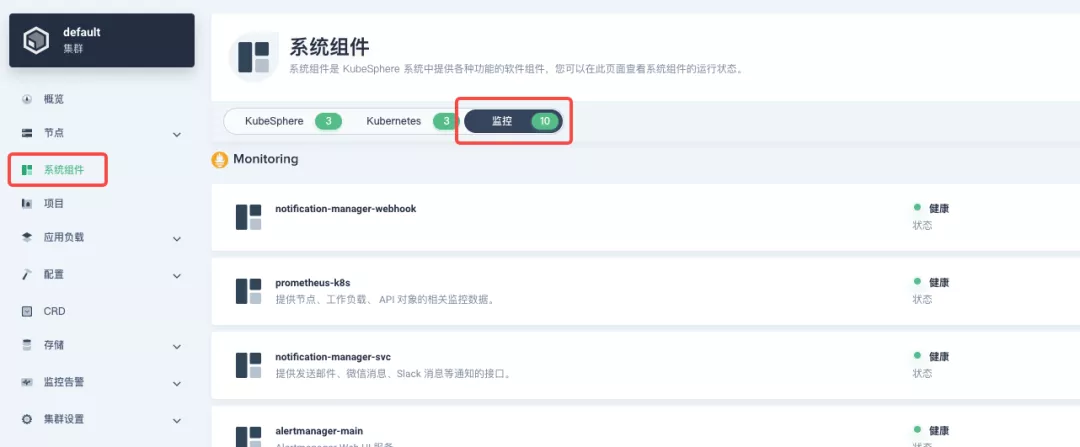
+The monitoring module is already included in the minimal installation of KubeSphere, so there is no need to enable it additionally, and you can confirm the installation status via the Monitoring tab on the System Components page.
+
+
+
+### Deploying the httpbin demo application
+
+Since we need to demonstrate the access control capabilities of the gateway, we must first have an accessible application as a backend service for the gateway. Here we use the [kennethreitz/httpbin](https://hub.docker.com/r/kennethreitz/httpbin/) container application provided by [httpbin.org](httpbin.org) as our demo application.
+
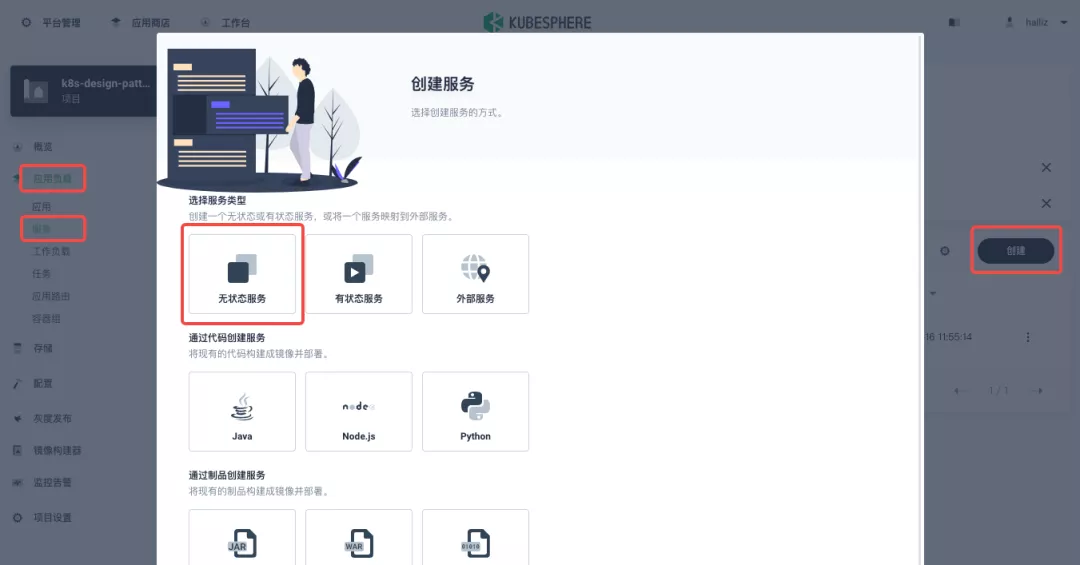
+In KubeSphere, we can either create a new project or use an existing one. After entering the project page, select "Services" under "Application Loads" to directly create a stateless workload and generate a companion service.
+
+
+
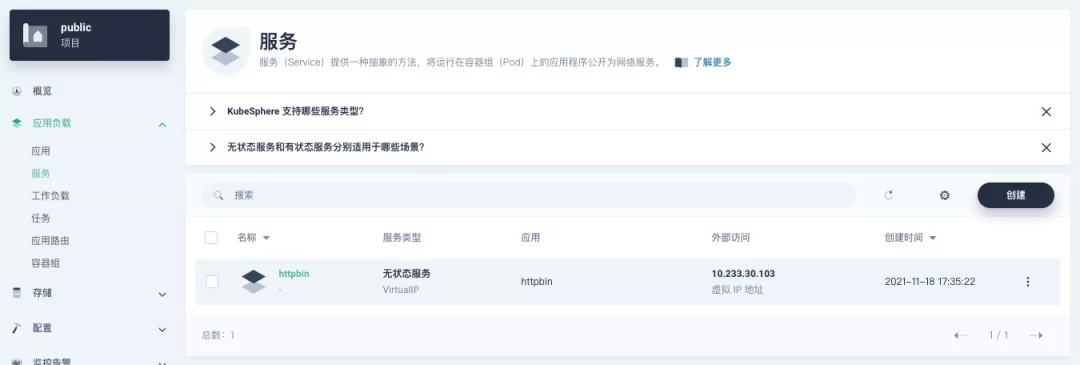
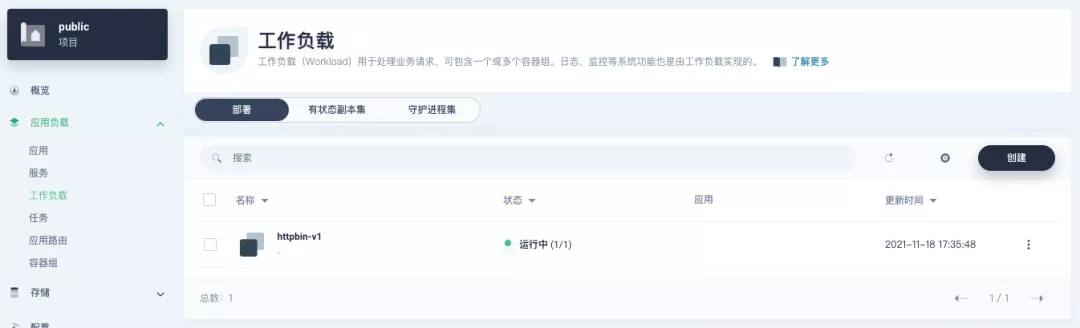
+Use the default port `80` of the [kennethreitz/httpbin](https://hub.docker.com/r/kennethreitz/httpbin/) container as the service port, and make sure you can see the corresponding entry for `httpbin` under both the Workloads and Services pages after creation, as shown in the following image.
+
+
+
+
+
+### Additional Project Gateway Details
+
+The **Project Gateway** is a feature that has been live since KubeSphere 3.0. The Gateway in the KubeSphere Project is an NGINX Ingress controller. The mechanism built into KubeSphere for HTTP load balancing is called **Application Routing**, which defines the rules for connecting from the outside to the clustered service. To allow access to services from the outside, users can create routing resources to define URI paths, back-end service names, and other information.
+
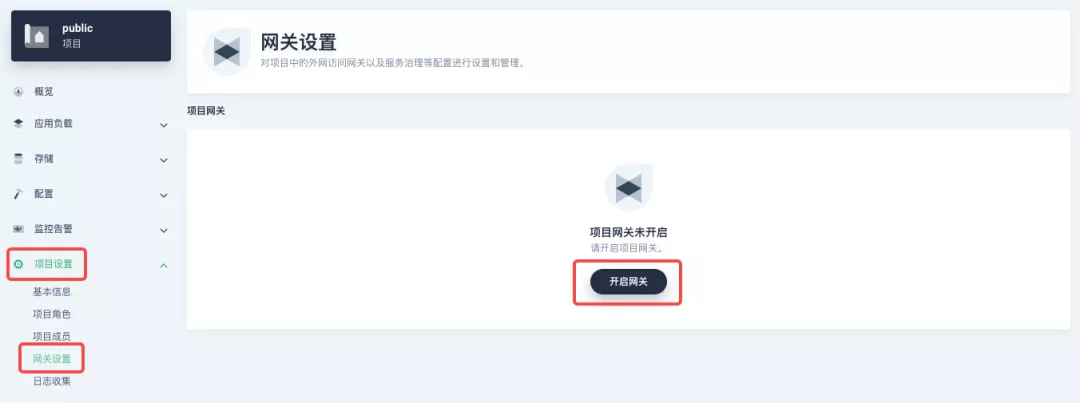
+Following the `httpbin` service project deployed above, open the Gateway Settings page in Project Settings and perform the "Enable Gateway" operation. For convenience, just select `NodePort` as the "Access Method".
+
+
+
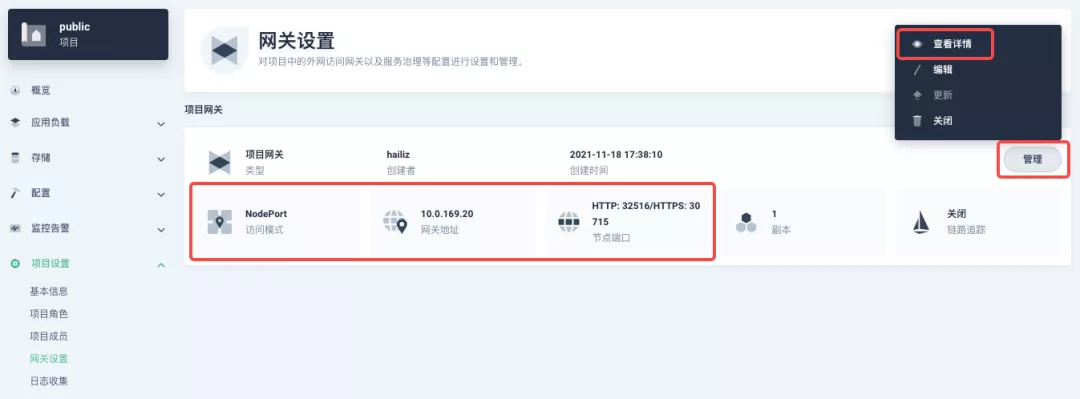
+After OK, go back to the Gateway page, wait for a moment and refresh the page, you can get the deployment completion status as shown below, where you can see that NodePort is given two node ports by default. Next, we use the "Manage" button in the upper right corner to "View Details".
Review comment:
After OK is not ok...
##########
File path: website/blog/2021/11/30/use-ingress-in-kubesphere.md
##########
@@ -0,0 +1,439 @@
+---
+title: "Using Apache APISIX Ingress Gateway to access Custom Monitoring in KubeSphere"
+author: "Haili Zhang"
+authorURL: "https://github.com/webup"
+authorImageURL: "https://avatars.githubusercontent.com/u/2936504?v=4"
+keywords:
+- KubeSphere
+- Apache APISIX
+- Kubenetes
+- Ingress Controller
+- Monitor
+description: This article will take Apache APISIX Ingress Controller as an example to show you in detail how to quickly use different types of gateways and status monitoring for Kubernetes clusters through KubeSphere.
+tags: [Technology]
+---
+
+> This article will take Apache APISIX Ingress Controller as an example to show you in detail how to quickly use different types of gateways and status monitoring for Kubernetes clusters through KubeSphere.
+
+<!--truncate-->
+
+In early November, KubeSphere released version 3.2.0, which added a full set of monitoring and management pages for project gateways, and introduced cluster gateways to provide global Ingress gateway capabilities at the cluster level.
+
+To help users better understand how to deploy and use third-party Ingress Controllers in the new version of KubeSphere, this article will use the [Apache APISIX Ingress Controller](https://apisix.apache.org/docs/ingress-controller/getting-started/) as an example to show you how to quickly use different types of gateways for Kubernetes clusters with KubeSphere and perform status monitoring.
+
+## Preparation
+
+### Installing KubeSphere
+
+There are two ways to install KubeSphere.
+
+1. Install directly on [Linux](https://kubesphere.com.cn/docs/quick-start/all-in-one-on-linux/)
+2. Install on [existing Kubernetes](https://kubesphere.com.cn/docs/quick-start/minimal-kubesphere-on-k8s/)
+
+The monitoring module is already included in the minimal installation of KubeSphere, so there is no need to enable it additionally, and you can confirm the installation status via the Monitoring tab on the System Components page.
+
+
+
+### Deploying the httpbin demo application
+
+Since we need to demonstrate the access control capabilities of the gateway, we must first have an accessible application as a backend service for the gateway. Here we use the [kennethreitz/httpbin](https://hub.docker.com/r/kennethreitz/httpbin/) container application provided by [httpbin.org](httpbin.org) as our demo application.
+
+In KubeSphere, we can either create a new project or use an existing one. After entering the project page, select "Services" under "Application Loads" to directly create a stateless workload and generate a companion service.
+
+
+
+Use the default port `80` of the [kennethreitz/httpbin](https://hub.docker.com/r/kennethreitz/httpbin/) container as the service port, and make sure you can see the corresponding entry for `httpbin` under both the Workloads and Services pages after creation, as shown in the following image.
+
+
+
+
+
+### Additional Project Gateway Details
+
+The **Project Gateway** is a feature that has been live since KubeSphere 3.0. The Gateway in the KubeSphere Project is an NGINX Ingress controller. The mechanism built into KubeSphere for HTTP load balancing is called **Application Routing**, which defines the rules for connecting from the outside to the clustered service. To allow access to services from the outside, users can create routing resources to define URI paths, back-end service names, and other information.
+
+Following the `httpbin` service project deployed above, open the Gateway Settings page in Project Settings and perform the "Enable Gateway" operation. For convenience, just select `NodePort` as the "Access Method".
+
+
+
+After OK, go back to the Gateway page, wait for a moment and refresh the page, you can get the deployment completion status as shown below, where you can see that NodePort is given two node ports by default. Next, we use the "Manage" button in the upper right corner to "View Details".
+
+
+
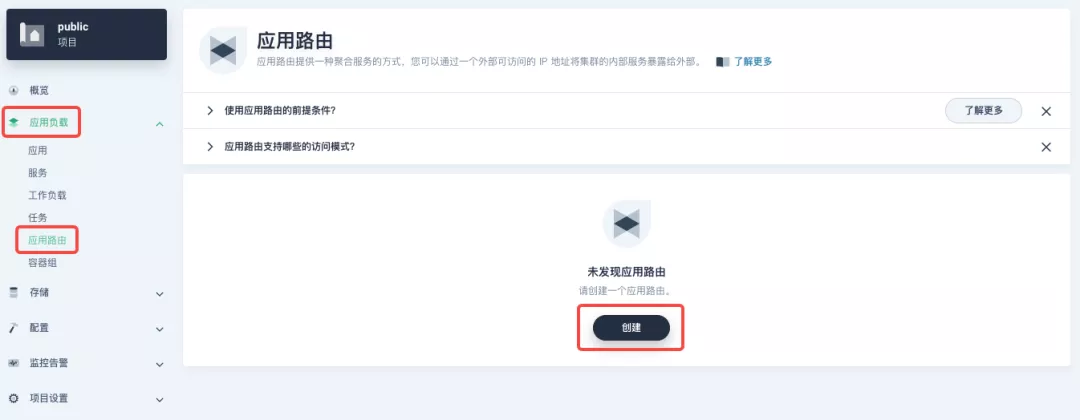
+At this point we are looking at the new monitoring page for the project/cluster gateway in version 3.2.0. Next we need to create an application route for the httpbin service.
+
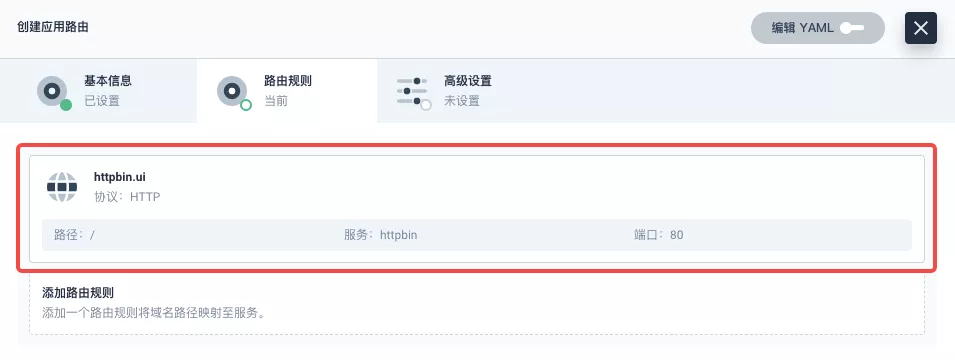
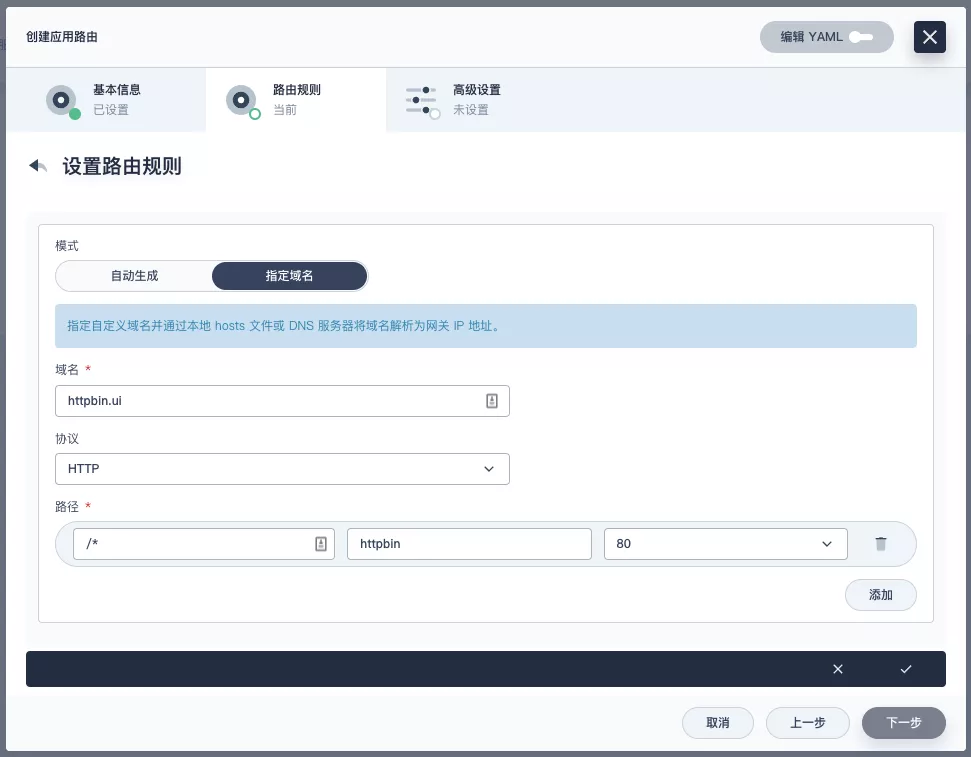
+Go to the Application Routing page from Application Load and start "creating" the route. After naming the route `httpbin`, we specify a domain name for testing purposes and set the "path" to `/`, select "service" `httpbin` and "port" `80`.
+
+
+
+
+
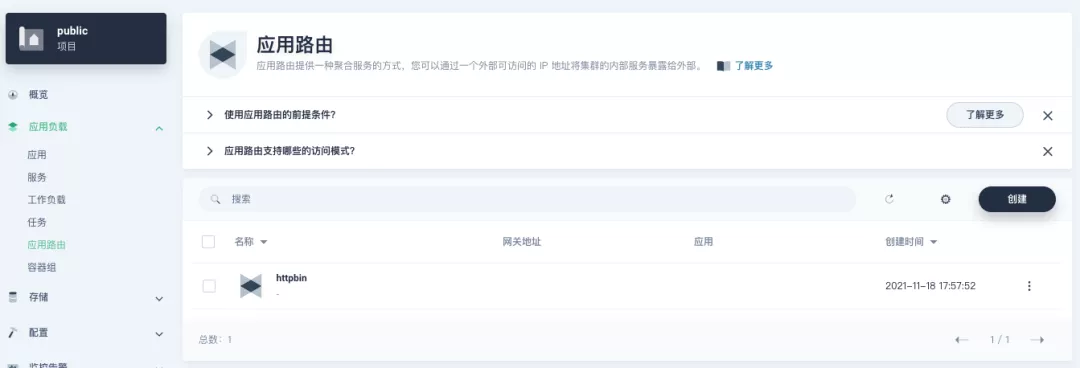
+After skipping the advanced settings in the next step, the route creation is completed and you can get the `httpbin` application route entry as shown in the figure below.
+
+
+
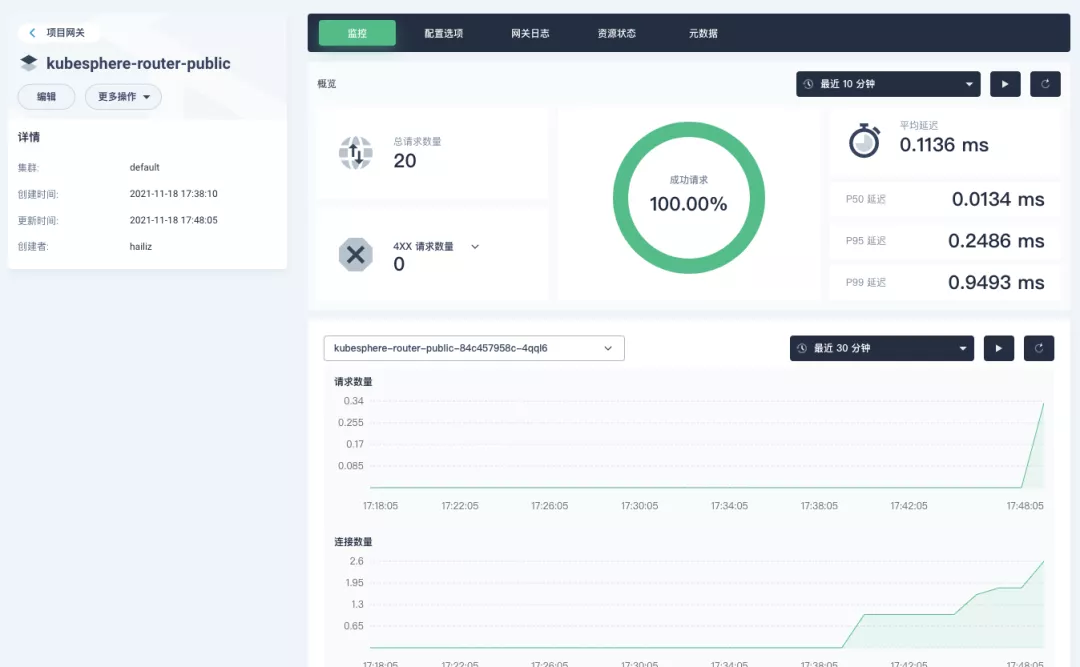
+Next, we can access the httpbin application service through the NodePort address of the project gateway and the specified domain name (e.g., http://httpbin.ui:32516 here), refresh or manipulate the request generation function of the page at will, and then enter the details page of the gateway, you can see that the "Monitoring" panel has appeared some built-in monitoring indicators.
+
+
+
+#### Specifying the NodePort Node Port
+
+For public cloud environments that use NodePort to expose access to the outside world, the open ports are usually limited and controlled, so we need to modify the NodePort used by the gateway.
+
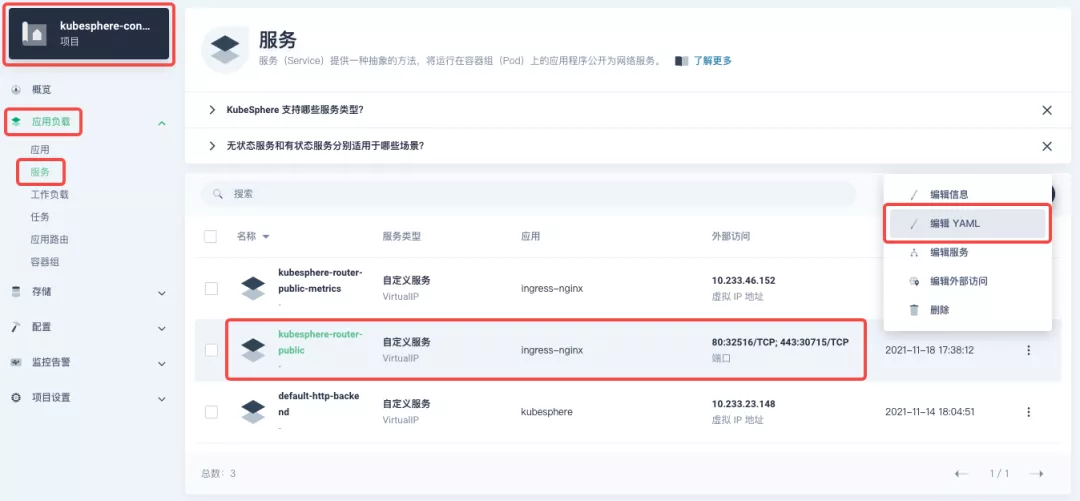
+Since the gateway is managed by KubeSphere, to modify the NodePort of the gateway service, you need to have access to the `kubesphere-controls-system` project. Once inside the project, you can find the gateway service named `kubesphere-router-<project-namespace>` on the "Services" page under "Application Load", and the NodePort is open for external access.
+
+
+
+## Getting Started with Clustered Gateways
+
+>KubeSphere 3.2.0 supports global gateways at the cluster level, so all projects can share the same gateway, and previously created project gateways are not affected by the cluster gateway. Gateways for all projects can be managed and configured centrally, eliminating the need to switch to a different enterprise space to configure gateways.
+
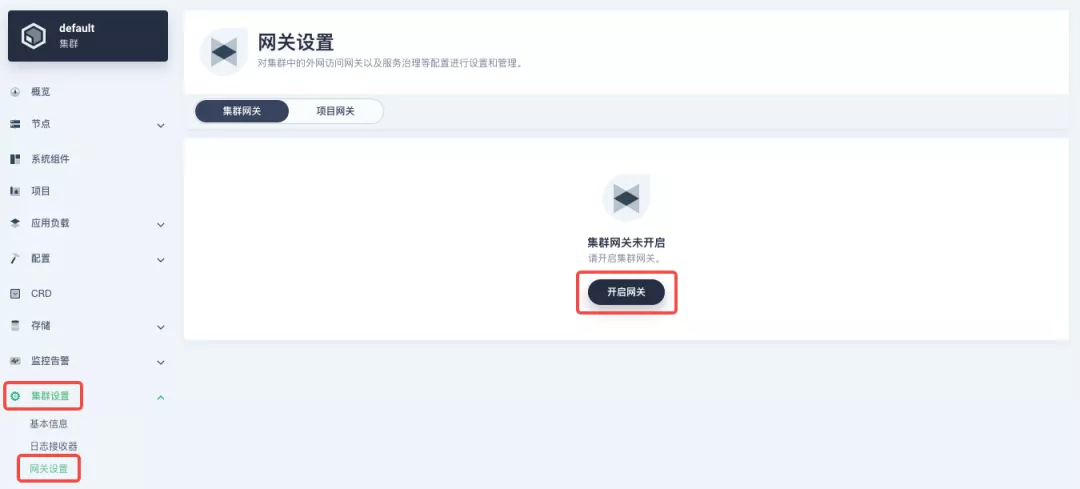
+If you are using KubeSphere version 3.2.0, we recommend using the cluster gateway feature to unify the application routing across the cluster. To enable the cluster gateway, it's very simple: use an account with cluster management privileges to access one of the clusters you can manage (e.g. default cluster here), and under "Gateway Settings" in "Cluster Settings", you can "Enable Gateway" and view the "Project Gateway".
+
+
+
+The way the cluster gateway is opened and the modification of the aligned NodePort access port are basically the same as the previous project gateway, so we won't go into details here.
+
+However, there is one point that needs special attention: after the cluster gateway is opened, the gateway of the project that has been opened will remain; however, the project that has not yet created a gateway cannot create a separate gateway, and will use the cluster gateway directly.
+
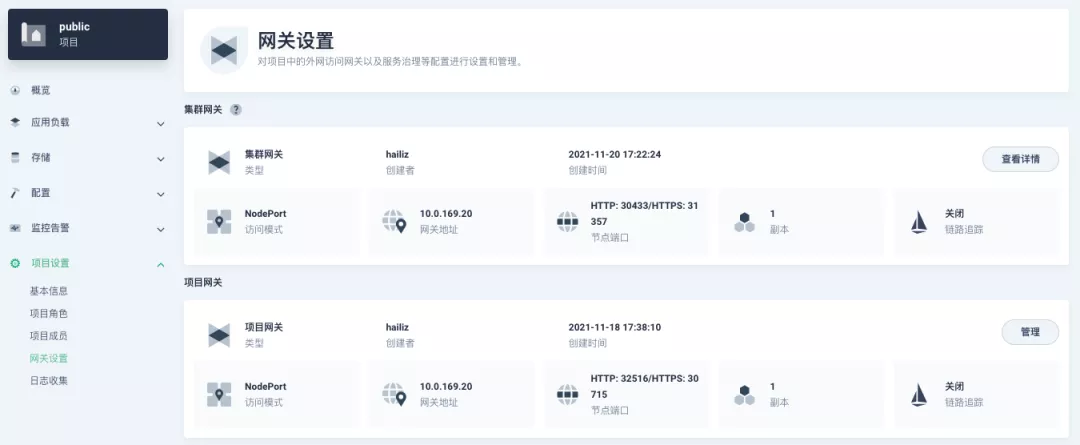
+The following figure shows the overview of all gateways in the "Gateway Settings" page for projects that have already created gateways, after having both project and cluster gateways.
+
+
+
+## A Quick Look at Apache APISIX Ingress Controller
+
+Apache APISIX is an open source, high-performance, dynamic cloud-native gateway donated to the Apache Foundation by Shenzhen Tributary Technology Co. in 2019, and is now the top open source project of the Apache Foundation and the most active gateway project on GitHub.Apache APISIX currently covers API gateways, LB Kubernetes Ingress, Service Mesh, and many other scenarios.
+
+### How to deploy
+
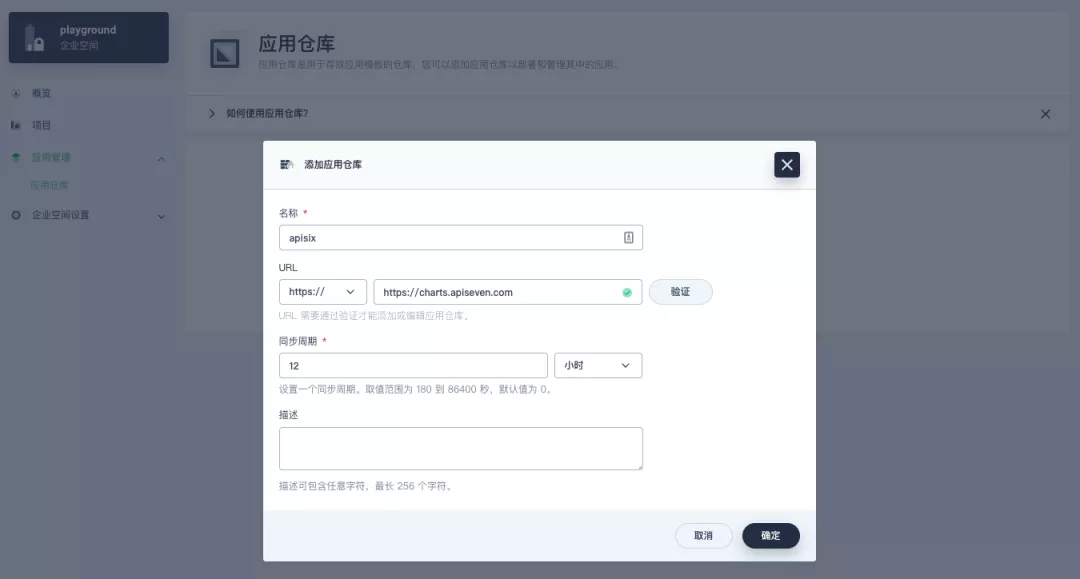
+First add the Apache APISIX Helm Chart repository. After that, select an enterprise space and add the following [Apache APISIX repository](https://charts.apiseven.com) via "Application Repository" under "Application Management".
+
+
+
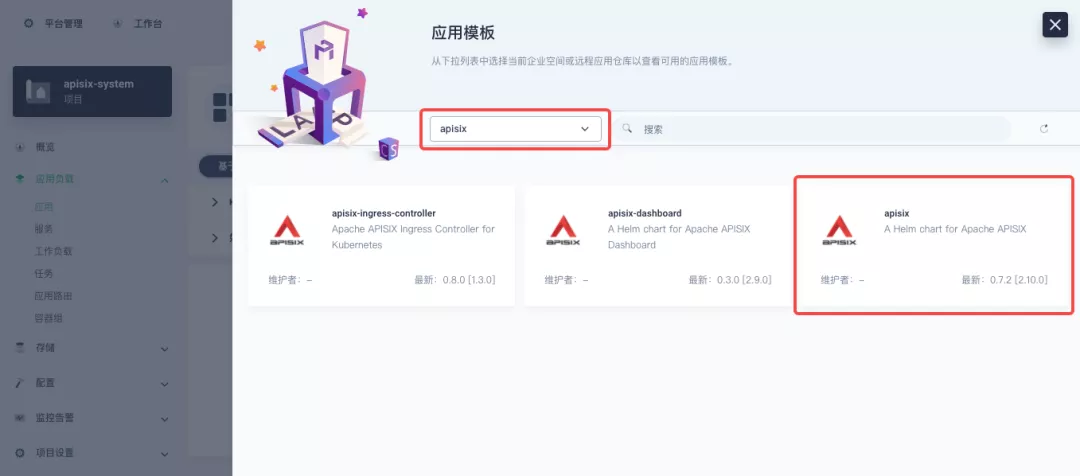
+Next, create a project named `apisix-system`. Once you are on the project page, select the Create an Application in Application Load method to deploy Apache APISIX, and select the `apisix` application template to start the deployment.
+
+
+
+>Why deploy the Apache APISIX application Helm Chart directly instead of deploying the Apache APISIX Ingress Controller directly?
+
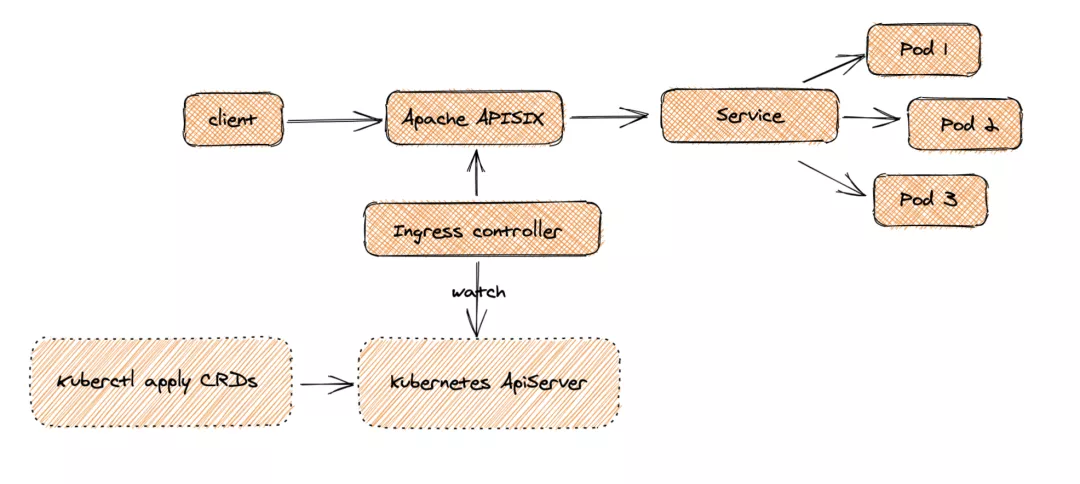
+This is because the Apache APISIX Ingress Controller is currently strongly associated with the Apache APISIX Gateway (as shown in the figure below), and it is currently most convenient to deploy Apache APISIX Gateway + Dashboard + Ingress Controller through Apache APISIX Helm Charts at the same time. Ingress Controller is the most convenient, so this article recommends using Apache APISIX Helm Charts directly for the deployment of the whole set of components.
+
+
+
+Name the application apisix to avoid mismatches between workloads and service names of multiple components (Gateway, Dashboard, Ingress Controller); in the "Application Settings" section edited in the installation steps, please fill in the following configuration (please pay special attention to the notes marked with [Note], the rest (The rest can be edited and modified by yourself as needed).
+
+```shell
+global:
+ imagePullSecrets: []
+
+apisix:
+ enabled: true
+ customLuaSharedDicts: []
+ image:
+ repository: apache/apisix
+ pullPolicy: IfNotPresent
+ tag: 2.10.1-alpine
+ replicaCount: 1
+ podAnnotations: {}
+ podSecurityContext: {}
+ securityContext: {}
+ resources: {}
+ nodeSelector: {}
+ tolerations: []
+ affinity: {}
+ podAntiAffinity:
+ enabled: false
+
+nameOverride: ''
+fullnameOverride: ''
+
+gateway:
+ type: NodePort
+ externalTrafficPolicy: Cluster
+ http:
+ enabled: true
+ servicePort: 80
+ containerPort: 9080
+ tls:
+ enabled: false
+ servicePort: 443
+ containerPort: 9443
+ existingCASecret: ''
+ certCAFilename: ''
+ http2:
+ enabled: true
+ stream:
+ enabled: false
+ only: false
+ tcp: []
+ udp: []
+ ingress:
+ enabled: false
+ annotations: {}
+ hosts:
+ - host: apisix.local
+ paths: []
+ tls: []
+
+admin:
+ enabled: true
+ type: ClusterIP
+ externalIPs: []
+ port: 9180
+ servicePort: 9180
+ cors: true
+ credentials:
+ admin: edd1c9f034335f136f87ad84b625c8f1
+ viewer: 4054f7cf07e344346cd3f287985e76a2
+ allow:
+ ipList:
+ - 0.0.0.0/0
+
+plugins:
+ - api-breaker
+ - authz-keycloak
+ - basic-auth
+ - batch-requests
+ - consumer-restriction
+ - cors
+ - echo
+ - fault-injection
+ - grpc-transcode
+ - hmac-auth
+ - http-logger
+ - ip-restriction
+ - ua-restriction
+ - jwt-auth
+ - kafka-logger
+ - key-auth
+ - limit-conn
+ - limit-count
+ - limit-req
+ - node-status
+ - openid-connect
+ - authz-casbin
+ - prometheus
+ - proxy-cache
+ - proxy-mirror
+ - proxy-rewrite
+ - redirect
+ - referer-restriction
+ - request-id
+ - request-validation
+ - response-rewrite
+ - serverless-post-function
+ - serverless-pre-function
+ - sls-logger
+ - syslog
+ - tcp-logger
+ - udp-logger
+ - uri-blocker
+ - wolf-rbac
+ - zipkin
+ - traffic-split
+ - gzip
+ - real-ip
+ # [note] add this plug-in to cooperate with Dashboard to display service information
+ - server-info
+
+stream_plugins:
+ - mqtt-proxy
+ - ip-restriction
+ - limit-conn
+
+customPlugins:
+ enabled: true
+ luaPath: /opts/custom_plugins/?.lua
+ # [note] the following configuration ensures that the Prometheus plug-in can expose indicators to the outside world.
+ plugins:
+ - name: prometheus
+ attrs:
+ export_addr:
+ ip: 0.0.0.0
+ port: 9091
+ configMap:
+ name: prometheus
+ mounts: []
+
+dns:
+ resolvers:
+ - 127.0.0.1
+ - 172.20.0.10
+ - 114.114.114.114
+ - 223.5.5.5
+ - 1.1.1.1
+ - 8.8.8.8
+ validity: 30
+ timeout: 5
+
+autoscaling:
+ enabled: false
+ minReplicas: 1
+ maxReplicas: 100
+ targetCPUUtilizationPercentage: 80
+ targetMemoryUtilizationPercentage: 80
+
+configurationSnippet:
+ main: ''
+ httpStart: ''
+ httpEnd: ''
+ httpSrv: ''
+ httpAdmin: ''
+ stream: ''
+
+etcd:
+ enabled: true
+ host:
+ - 'http://etcd.host:2379'
+ prefix: /apisix
+ timeout: 30
+ auth:
+ rbac:
+ enabled: false
+ user: ''
+ password: ''
+ tls:
+ enabled: false
+ existingSecret: ''
+ certFilename: ''
+ certKeyFilename: ''
+ verify: true
+ service:
+ port: 2379
+ replicaCount: 3
+
+dashboard:
+ enabled: true
+ # [note] Enable NodePort for Dashboard to facilitate subsequent use
+ service:
+ type: NodePort
+
+ingress-controller:
+ enabled: true
+ config:
+ apisix:
+ # [note] Be sure to set the namespace where gateway is located
+ serviceNamespace: apisix-system
+ serviceMonitor:
+ enabled: true
+ namespace: 'apisix-system'
+ interval: 15s
+```
+
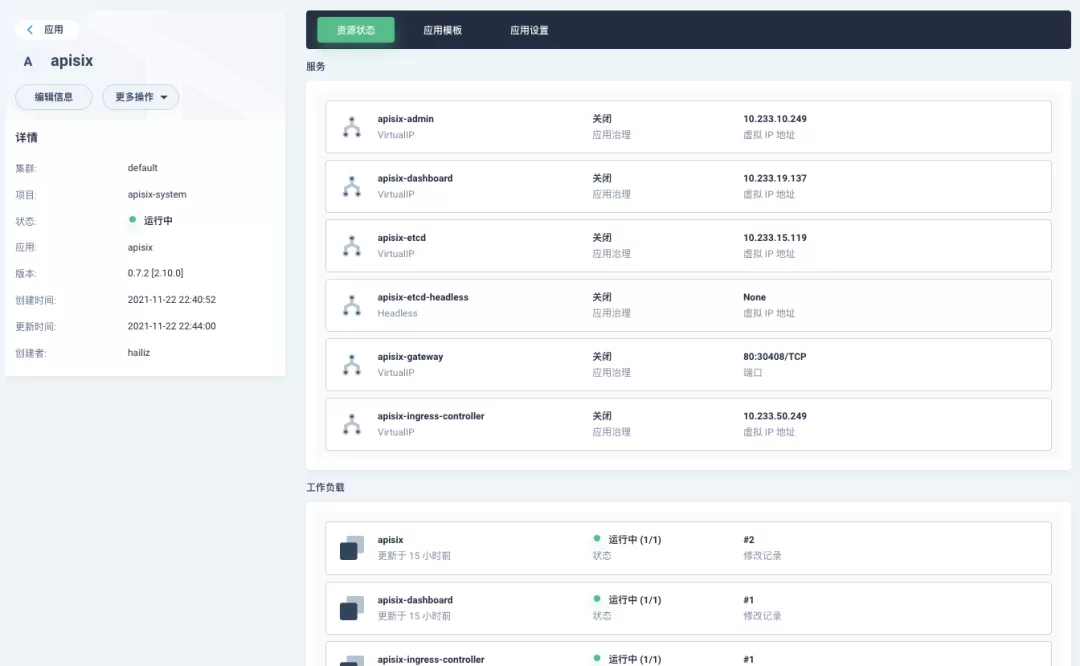
+After successful deployment, click the application name to enter the details page, and you can see the following service deployment and working status operation status display under the "Resource Status" tab.
+
+
+
+>💡 The default configuration parameters for the other two Helm Charts of the Apache APISIX project can be found in [Dashboard](https://github.com/apache/apisix-helm-chart/blob/master/charts/apisix-dashboard/values.yaml) and [Ingress Controller](https://github.com/apache/apisix-helm-chart/blob/master/charts/apisix-ingress-controller/values.yaml) `values.yaml`.
+
+### Dashboard Usage
+
+After the Apache APISIX application is deployed, you can check the current status of the Apache APISIX gateway through the Apache APISIX Dashboard.
+
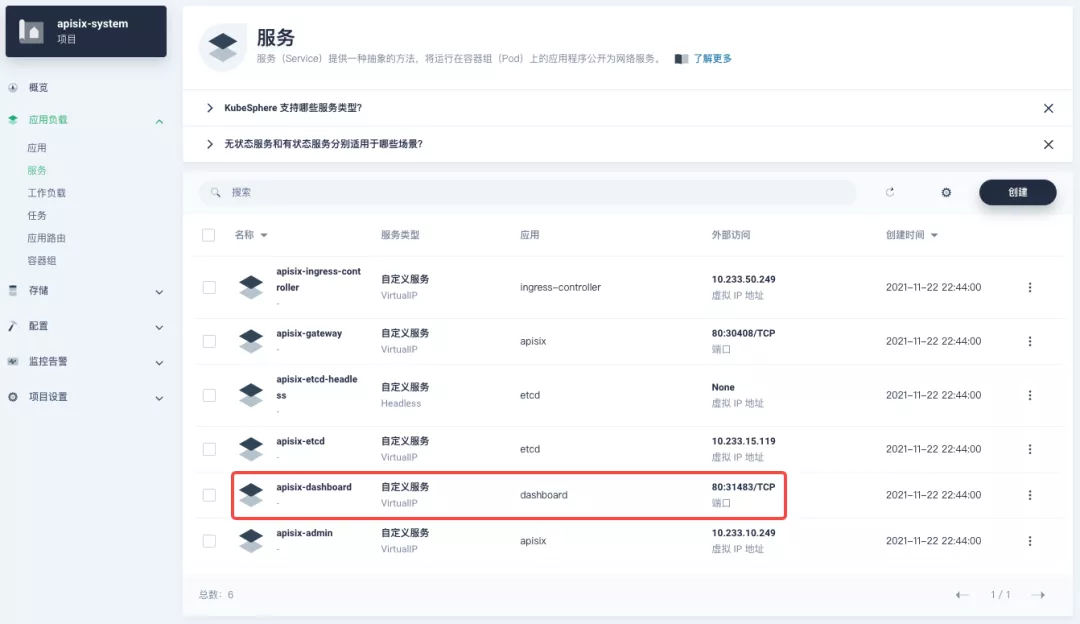
+You can find the `apisix-dashboard` service from the application load-services page. Since we have enabled NodePort for Dashboard in the application configuration, you can access Dashboard directly through the NodePort port here.
+
+
+
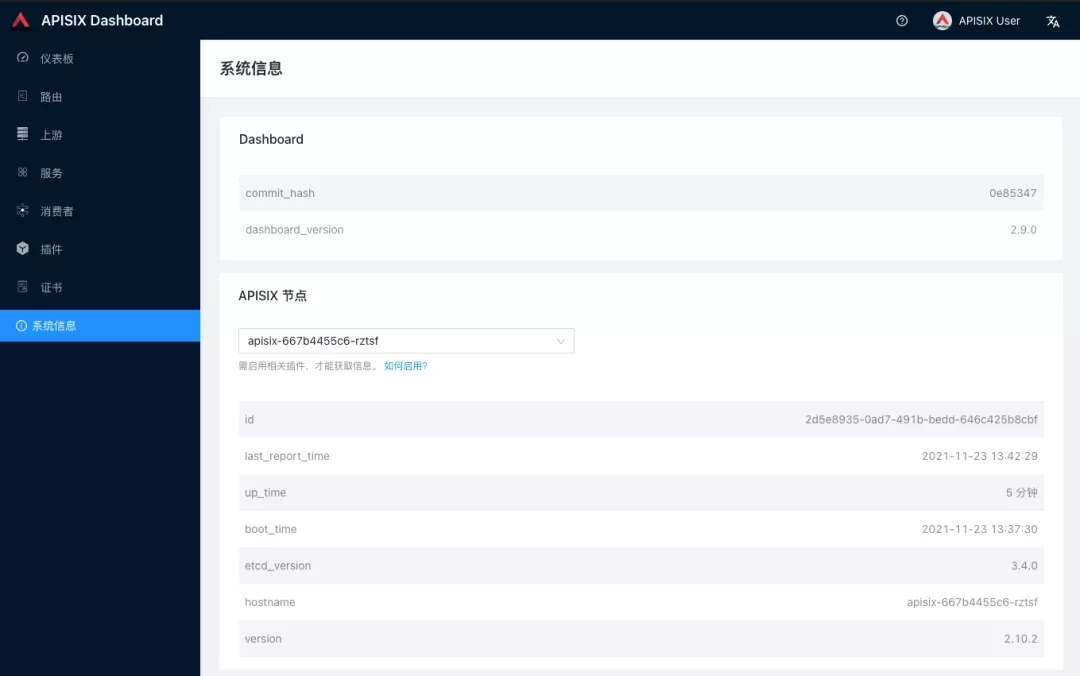
+Log in to the Apache APISIX Dashboard with the default user name and password `admin`, and you can enter the System Information page to view the information of Apache APISIX nodes currently connected to management.
+
+
+
+### How to use
+
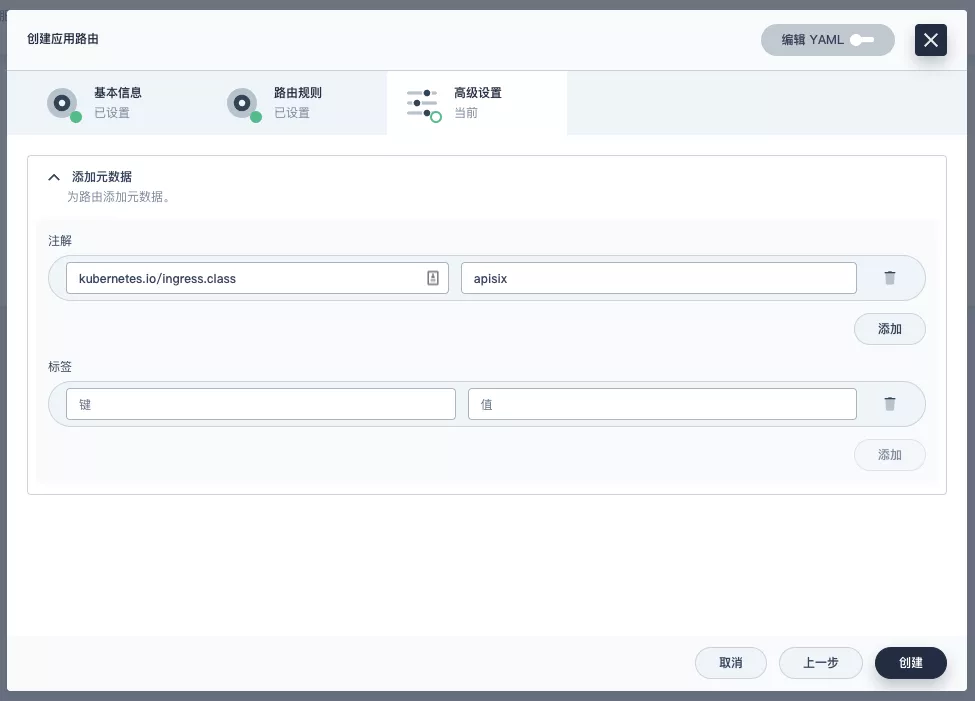
+Next, let's go back to the "Apply Routes" page, create another route (e.g. `apisix-httpbin`), set the path to `/*` `httpbin` `80` and add the key `kubernetes.io/ingress.class`: `apisix` to it.
+
+
+
+
+
+#### Verify that the application route is effective
+
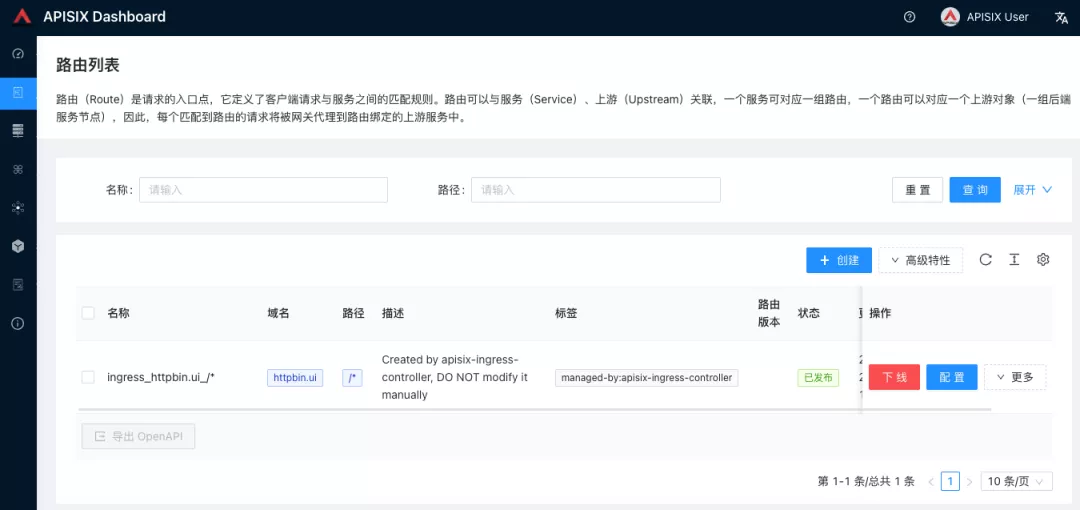
+Go back to the Apache APISIX Dashboard and enter the "Routes" page. You can see that the newly created application route has been recognized by the Apache APISIX Ingress Controller and automatically added to the Apache APISIX gateway, and you can also see an automatically created upstream entry in the "Upstream" page.
+
+
+
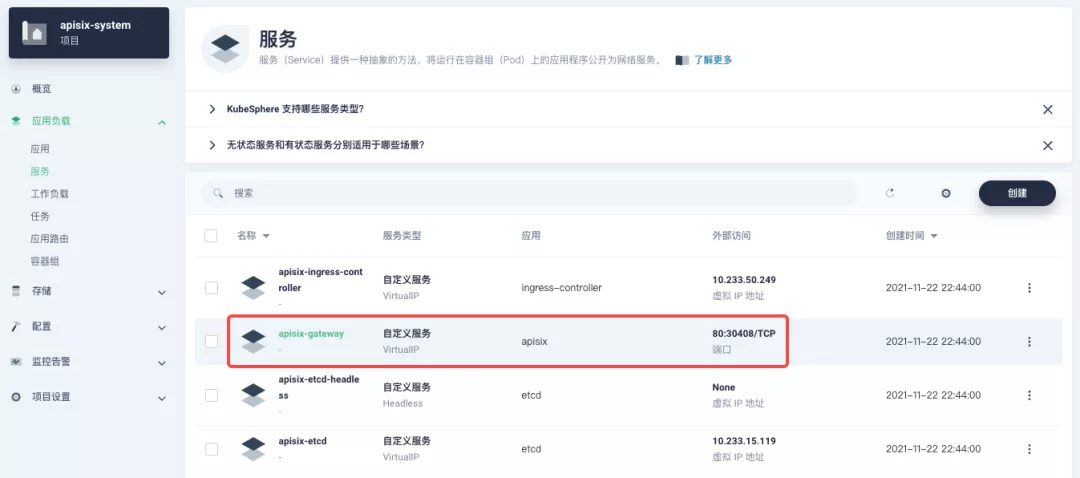
+Next, go back to the `apisix-system` project "Services" page, find the port corresponding to the `apisix-gateway` service, and access `<apisix-httpbin application routing domain name>:<apisix-gateway external access port>` (for example, `httpbin.ui:30408` here) to access the backend service associated with the `apisix-httpbin` application route.
+
+
+
+## Custom Monitoring of Apache APISIX Gateways
+
+Monitoring capabilities can be augmented when using the Apache APISIX gateway through the Prometheus plug-in and the custom monitoring capabilities that come with KubeSphere.
+
+### Exposing relevant Prometheus monitoring metrics
+
+Since we have already enabled the [Prometheus plugin](https://apisix.apache.org/docs/apisix/plugins/prometheus) when deploying the Apache APISIX application, we only need to expose the interface to the Prometheus monitoring metrics.
+
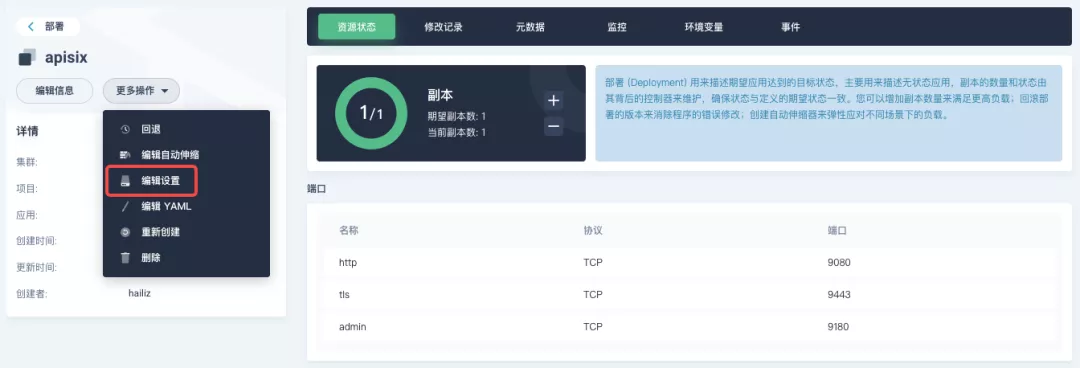
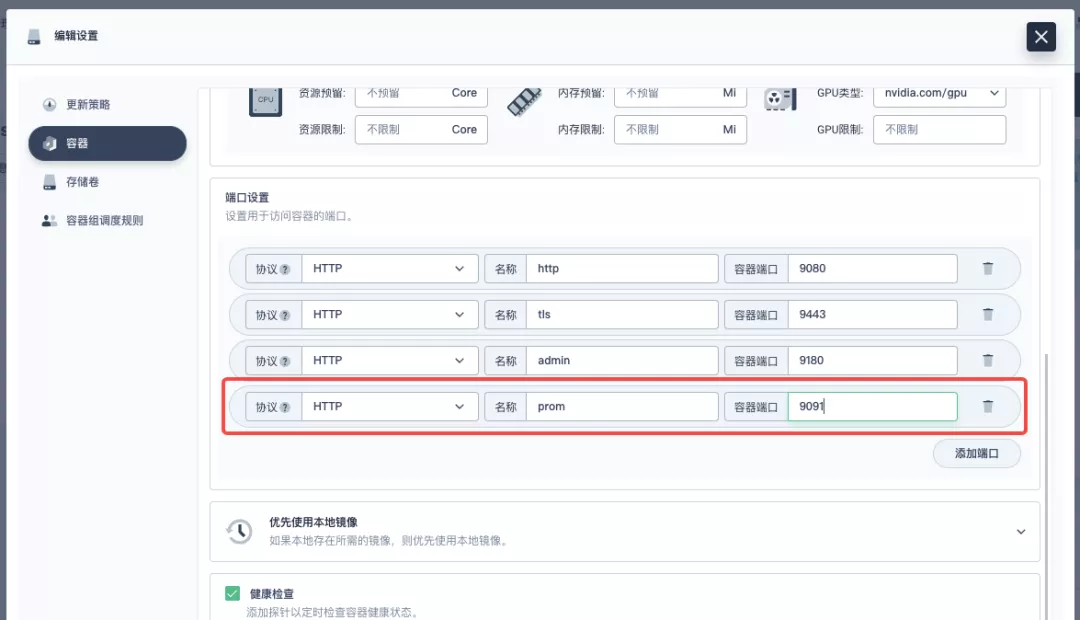
+Go to the `apisix-system` project, find apisix on the "Workloads" page and go to the deployment details page, then select "Edit Settings" from "More Actions" in the left action panel.
+
+
+
+In the pop-up panel, go to the `apisix` container editing interface, find "Port Settings", add a new port named `prom` to map to port `9091` of the container, save it and the `apisix` workload will restart.
+
+
+
+### Creating a ServiceMonitor for monitoring metrics
+
+Next, we need to connect the exposed metrics interface to KubeSphere's own Prometheus to make it accessible (to grab the metrics data).
+
+Since KubeSphere maintains the internal Prometheus system through the [Prometheus Operator](https://github.com/prometheus-operator/prometheus-operator), the quickest way to access the metrics is to create a ServiceMonitor resource directly.
+
+```shell
Review comment:
ditto, this looks like a json or yaml
##########
File path: website/blog/2021/11/30/use-ingress-in-kubesphere.md
##########
@@ -0,0 +1,439 @@
+---
+title: "Using Apache APISIX Ingress Gateway to access Custom Monitoring in KubeSphere"
+author: "Haili Zhang"
+authorURL: "https://github.com/webup"
+authorImageURL: "https://avatars.githubusercontent.com/u/2936504?v=4"
+keywords:
+- KubeSphere
+- Apache APISIX
+- Kubenetes
+- Ingress Controller
+- Monitor
+description: This article will take Apache APISIX Ingress Controller as an example to show you in detail how to quickly use different types of gateways and status monitoring for Kubernetes clusters through KubeSphere.
+tags: [Technology]
+---
+
+> This article will take Apache APISIX Ingress Controller as an example to show you in detail how to quickly use different types of gateways and status monitoring for Kubernetes clusters through KubeSphere.
+
+<!--truncate-->
+
+In early November, KubeSphere released version 3.2.0, which added a full set of monitoring and management pages for project gateways, and introduced cluster gateways to provide global Ingress gateway capabilities at the cluster level.
+
+To help users better understand how to deploy and use third-party Ingress Controllers in the new version of KubeSphere, this article will use the [Apache APISIX Ingress Controller](https://apisix.apache.org/docs/ingress-controller/getting-started/) as an example to show you how to quickly use different types of gateways for Kubernetes clusters with KubeSphere and perform status monitoring.
+
+## Preparation
+
+### Installing KubeSphere
+
+There are two ways to install KubeSphere.
+
+1. Install directly on [Linux](https://kubesphere.com.cn/docs/quick-start/all-in-one-on-linux/)
+2. Install on [existing Kubernetes](https://kubesphere.com.cn/docs/quick-start/minimal-kubesphere-on-k8s/)
+
+The monitoring module is already included in the minimal installation of KubeSphere, so there is no need to enable it additionally, and you can confirm the installation status via the Monitoring tab on the System Components page.
+
+
+
+### Deploying the httpbin demo application
+
+Since we need to demonstrate the access control capabilities of the gateway, we must first have an accessible application as a backend service for the gateway. Here we use the [kennethreitz/httpbin](https://hub.docker.com/r/kennethreitz/httpbin/) container application provided by [httpbin.org](httpbin.org) as our demo application.
+
+In KubeSphere, we can either create a new project or use an existing one. After entering the project page, select "Services" under "Application Loads" to directly create a stateless workload and generate a companion service.
+
+
+
+Use the default port `80` of the [kennethreitz/httpbin](https://hub.docker.com/r/kennethreitz/httpbin/) container as the service port, and make sure you can see the corresponding entry for `httpbin` under both the Workloads and Services pages after creation, as shown in the following image.
+
+
+
+
+
+### Additional Project Gateway Details
+
+The **Project Gateway** is a feature that has been live since KubeSphere 3.0. The Gateway in the KubeSphere Project is an NGINX Ingress controller. The mechanism built into KubeSphere for HTTP load balancing is called **Application Routing**, which defines the rules for connecting from the outside to the clustered service. To allow access to services from the outside, users can create routing resources to define URI paths, back-end service names, and other information.
+
+Following the `httpbin` service project deployed above, open the Gateway Settings page in Project Settings and perform the "Enable Gateway" operation. For convenience, just select `NodePort` as the "Access Method".
+
+
+
+After OK, go back to the Gateway page, wait for a moment and refresh the page, you can get the deployment completion status as shown below, where you can see that NodePort is given two node ports by default. Next, we use the "Manage" button in the upper right corner to "View Details".
+
+
+
+At this point we are looking at the new monitoring page for the project/cluster gateway in version 3.2.0. Next we need to create an application route for the httpbin service.
+
+Go to the Application Routing page from Application Load and start "creating" the route. After naming the route `httpbin`, we specify a domain name for testing purposes and set the "path" to `/`, select "service" `httpbin` and "port" `80`.
+
+
+
+
+
+After skipping the advanced settings in the next step, the route creation is completed and you can get the `httpbin` application route entry as shown in the figure below.
+
+
+
+Next, we can access the httpbin application service through the NodePort address of the project gateway and the specified domain name (e.g., http://httpbin.ui:32516 here), refresh or manipulate the request generation function of the page at will, and then enter the details page of the gateway, you can see that the "Monitoring" panel has appeared some built-in monitoring indicators.
+
+
+
+#### Specifying the NodePort Node Port
+
+For public cloud environments that use NodePort to expose access to the outside world, the open ports are usually limited and controlled, so we need to modify the NodePort used by the gateway.
+
+Since the gateway is managed by KubeSphere, to modify the NodePort of the gateway service, you need to have access to the `kubesphere-controls-system` project. Once inside the project, you can find the gateway service named `kubesphere-router-<project-namespace>` on the "Services" page under "Application Load", and the NodePort is open for external access.
+
+
+
+## Getting Started with Clustered Gateways
+
+>KubeSphere 3.2.0 supports global gateways at the cluster level, so all projects can share the same gateway, and previously created project gateways are not affected by the cluster gateway. Gateways for all projects can be managed and configured centrally, eliminating the need to switch to a different enterprise space to configure gateways.
+
+If you are using KubeSphere version 3.2.0, we recommend using the cluster gateway feature to unify the application routing across the cluster. To enable the cluster gateway, it's very simple: use an account with cluster management privileges to access one of the clusters you can manage (e.g. default cluster here), and under "Gateway Settings" in "Cluster Settings", you can "Enable Gateway" and view the "Project Gateway".
+
+
+
+The way the cluster gateway is opened and the modification of the aligned NodePort access port are basically the same as the previous project gateway, so we won't go into details here.
+
+However, there is one point that needs special attention: after the cluster gateway is opened, the gateway of the project that has been opened will remain; however, the project that has not yet created a gateway cannot create a separate gateway, and will use the cluster gateway directly.
+
+The following figure shows the overview of all gateways in the "Gateway Settings" page for projects that have already created gateways, after having both project and cluster gateways.
+
+
+
+## A Quick Look at Apache APISIX Ingress Controller
+
+Apache APISIX is an open source, high-performance, dynamic cloud-native gateway donated to the Apache Foundation by Shenzhen Tributary Technology Co. in 2019, and is now the top open source project of the Apache Foundation and the most active gateway project on GitHub.Apache APISIX currently covers API gateways, LB Kubernetes Ingress, Service Mesh, and many other scenarios.
+
+### How to deploy
+
+First add the Apache APISIX Helm Chart repository. After that, select an enterprise space and add the following [Apache APISIX repository](https://charts.apiseven.com) via "Application Repository" under "Application Management".
+
+
+
+Next, create a project named `apisix-system`. Once you are on the project page, select the Create an Application in Application Load method to deploy Apache APISIX, and select the `apisix` application template to start the deployment.
+
+
+
+>Why deploy the Apache APISIX application Helm Chart directly instead of deploying the Apache APISIX Ingress Controller directly?
+
+This is because the Apache APISIX Ingress Controller is currently strongly associated with the Apache APISIX Gateway (as shown in the figure below), and it is currently most convenient to deploy Apache APISIX Gateway + Dashboard + Ingress Controller through Apache APISIX Helm Charts at the same time. Ingress Controller is the most convenient, so this article recommends using Apache APISIX Helm Charts directly for the deployment of the whole set of components.
+
+
+
+Name the application apisix to avoid mismatches between workloads and service names of multiple components (Gateway, Dashboard, Ingress Controller); in the "Application Settings" section edited in the installation steps, please fill in the following configuration (please pay special attention to the notes marked with [Note], the rest (The rest can be edited and modified by yourself as needed).
+
+```shell
+global:
Review comment:
this looks like a json file
##########
File path: website/i18n/zh/docusaurus-plugin-content-blog/2021/11/30/use-ingress-in-kubesphere.md
##########
@@ -0,0 +1,441 @@
+---
+title: "在 KubeSphere 中使用 Apache APISIX Ingress 网关接入自定义监控"
+author: "张海立"
+authorURL: "https://github.com/webup"
+authorImageURL: "https://avatars.githubusercontent.com/u/2936504?v=4"
+keywords:
+- KubeSphere
+- Apache APISIX
+- Kubenetes
+- Ingress Controller
+- 监控
+description: 本文将通过 Apache APISIX Ingress Controller 为范例,详细为大家介绍如何通过 KubeSphere 快速为 Kubernetes 集群使用不同类型的网关并进行状态监控。
+tags: [Technology]
+---
+
+> 本文将通过 Apache APISIX Ingress Controller 为范例,详细为大家介绍如何通过 KubeSphere 快速为 Kubernetes 集群使用不同类型的网关并进行状态监控。
+
+<!--truncate-->
+
+11月初,KubeSphere 发布了 3.2.0 版本,新版本为项目网关增配了整套监控及管理页面,同时引入了集群网关来提供集群层面全局的 Ingress 网关能力。
+
+为了让用户更了解如何在新版 KubeSphere 中部署使用第三方 Ingress Controller,本文将以 [Apache APISIX Ingress Controller](https://apisix.apache.org/docs/ingress-controller/getting-started/) 为例,为大家展示通过 KubeSphere 快速为 Kubernetes 集群使用不同类型的网关并进行状态监控。
+
+## 准备工作
+
+### 安装 KubeSphere
+
+安装 KubeSphere 有两种方法:
+
+1. [在 Linux 上直接安装](https://kubesphere.com.cn/docs/quick-start/all-in-one-on-linux/)
+2. [在已有 Kubernetes 中安装](https://kubesphere.com.cn/docs/quick-start/minimal-kubesphere-on-k8s/)
+
+KubeSphere 最小化安装版本已经包含了监控模块,因此不需要额外启用,可以通过「系统组件」页面中的「监控」标签页确认安装状态。
+
+
+
+### 部署 httpbin 演示应用
+
+由于需要演示网关的访问控制能力,我们必须要先有一个可以访问的应用作为网关的后台服务。这里我们使用 [httpbin.org](httpbin.org) 提供的 [kennethreitz/httpbin](https://hub.docker.com/r/kennethreitz/httpbin/) 容器应用作为演示应用。
+
+在 KubeSphere 中,我们可以先创建新的项目或使用已有的项目,进入项目页面后,选择「应用负载」下的「服务」直接创建无状态工作负载并生成配套服务。
+
+
+
+使用 [kennethreitz/httpbin](https://hub.docker.com/r/kennethreitz/httpbin/) 容器默认的 `80` 端口作为服务端口,创建完成后确保在「工作负载」和「服务」页面下都可以看到 `httpbin` 的对应条目,如下图所示。
+
+
+
+
+
+### 项目网关细节补充
+
+**项目网关**是 KubeSphere 3.0 之后上线的功能。KubeSphere 项目中的网关是一个 NGINX Ingress 控制器。KubeSphere 内置用于 HTTP 负载均衡的机制称为**应用路由**,它定义了从外部到集群服务的连接规则。如需允许从外部访问服务,用户可创建路由资源来定义 URI 路径、后端服务名称等信息。
+
+承接上文中已部署的 `httpbin` 服务项目,在「项目设置」中打开「网关设置」页面,然后执行「开启网关」操作。方便起见,直接选择 `NodePort` 作为「访问方式」即可。
+
+
+
+确定后回到网关页面,稍等片刻后刷新页面,可以得到如下图显示的部署完成状态,在这里可以看到 NodePort 默认被赋予了两个节点端口。接招我们通过右上角的「管理」按钮「查看详情」。
+
+
+
+此时我们看到的便是 3.2.0 版本关于项目/集群网关的新监控页面。下面我们就需要为 httpbin 服务创建应用路由。
+
+从「应用负载」进入「应用路由」页面,开始「创建」路由。为路由取名为 `httpbin` 后,我们指定一个方便测试的域名,并设置「路径」为 `/`, 选择「服务」`httpbin` 和「端口」`80`。
+
+
+
+
+
+直接下一步跳过高级设置后完成路由创建,可以得到如下图所示的 httpbin 应用路由项。
+
+
+
+接下来我们就可以通过项目网关的 NodePort 地址及指定域名(如这里是 http://httpbin.ui:32516) 来访问 httpbin 应用服务,随意刷新或操作一下页面的请求生成功能,再进入网关的详情页面,便可以看到在「监控」面板上已经出现了网关的一些内置的监控指标展示。
+
+
+
+#### 指定 NodePort 节点端口
+
+对于公有云环境,如果使用 NodePort 方式向外暴露访问能力,开放端口通常是有限且受控的,因此对于网关所使用的 NodePort 我们需要对它进行修改。
+
+由于网关是被 KubeSphere 统一管理的,要修改网关服务的 NodePort 需要具备访问 `kubesphere-controls-system` 的项目权限。进入该项目后,通过「应用负载」的「服务」页面即可找到命名为 `kubesphere-router-<project-namespace>` 形式且外部访问已开放 NodePort 的网关服务。NodePort 服务端口需要通过「编辑 YAML」来直接修改。
+
+
+
+## 开始使用集群网关
+
+>KubeSphere 3.2.0 开始支持集群级别的全局网关,所有项目可共用同一个网关,之前已创建的项目网关也不会受到集群网关的影响。也可以统一纳管所有项目的网关,对其进行集中管理和配置,管理员用户再也不需要切换到不同的企业空间中去配置网关了。
+
+如果您使用的是是 KubeSphere 3.2.0 版本,我们更推荐大家使用集群网关的功能来统一整个集群的应用路由。要启用集群网关也非常简单:使用具备集群管理权限的账号,进入其可管理的某个集群(如我们这里以 `default` 集群为例),在「集群设置」的「网关设置」中即可「开启网关」,同时查看「项目网关」。
+
+
+
+集群网关开启的方式以及对齐 NodePort 访问端口的修改和之前项目网关的操作基本完全一致,这里就不多赘述了。
+
+但有一点需要特别注意:集群网关开启后,已经开启的项目网关还会保留;但尚未创建网关的项目是无法再创建单独的网关的,会直接使用集群网关。
+
+下图展示了已创建网关的项目,在同时拥有项目及集群网关后,在「网关设置」页面所呈现的所有网关概览。
+
+
+
+## 快速使用 Apache APISIX Ingress Controller
+
+Apache APISIX 是一款开源的高性能、动态云原生网关,由深圳支流科技有限公司于 2019 年捐赠给 Apache 基金会,目前已成为 Apache 基金会的顶级开源项目,也是 GitHub 上最活跃的网关项目。Apache APISIX 目前已覆盖 API 网关、LB、Kubernetes Ingress、Service Mesh 等多种场景。
+
+### 如何部署
+
+首先添加 Apache APISIX Helm Chart 仓库。之后选定一个企业空间,通过「应用管理」下的「应用仓库」来添加如下一个 [Apache APISIX 的仓库](https://charts.apiseven.com)。
+
+
+
+接下来创建一个名为 `apisix-system` 的项目。进入项目页面后,选择在「应用负载」中创建「应用」的方式来部署 Apache APISIX,并选择 `apisix` 应用模版开始进行部署。
+
+
+
+>为何是直接部署 Apache APISIX 应用的 Helm Chart,而不是直接部署 Apache APISIX Ingress Controller?
+
+这是因为 Apache APISIX Ingress Controller 目前和 Apache APISIX 网关是强关联的(如下图所示),且目前通过 Apache APISIX Helm Charts 同时部署 Apache APISIX Gateway + Dashboard + Ingress Controller 是最方便的,因此本文推荐直接使用 Apache APISIX 的 Helm Chart 进行整套组件的部署。
+
+
+
+将应用命名为 `apisix` 以避免多个组件(Gateway, Dashboard, Ingress Controller)的工作负载及服务名称产生不匹配的情况;在安装步骤中编辑的「应用设置」的部分,请参照以下配置进行填写(请特别注意带有【注意】标记的注释部分的说明,其余可以按需自行编辑修改)。
+
+```shell
+global:
+ imagePullSecrets: []
+
+apisix:
+ enabled: true
+ customLuaSharedDicts: []
+ image:
+ repository: apache/apisix
+ pullPolicy: IfNotPresent
+ tag: 2.10.1-alpine
+ replicaCount: 1
+ podAnnotations: {}
+ podSecurityContext: {}
+ securityContext: {}
+ resources: {}
+ nodeSelector: {}
+ tolerations: []
+ affinity: {}
+ podAntiAffinity:
+ enabled: false
+
+nameOverride: ''
+fullnameOverride: ''
+
+gateway:
+ type: NodePort
+ externalTrafficPolicy: Cluster
+ http:
+ enabled: true
+ servicePort: 80
+ containerPort: 9080
+ tls:
+ enabled: false
+ servicePort: 443
+ containerPort: 9443
+ existingCASecret: ''
+ certCAFilename: ''
+ http2:
+ enabled: true
+ stream:
+ enabled: false
+ only: false
+ tcp: []
+ udp: []
+ ingress:
+ enabled: false
+ annotations: {}
+ hosts:
+ - host: apisix.local
+ paths: []
+ tls: []
+
+admin:
+ enabled: true
+ type: ClusterIP
+ externalIPs: []
+ port: 9180
+ servicePort: 9180
+ cors: true
+ credentials:
+ admin: edd1c9f034335f136f87ad84b625c8f1
+ viewer: 4054f7cf07e344346cd3f287985e76a2
+ allow:
+ ipList:
+ - 0.0.0.0/0
+
+plugins:
+ - api-breaker
+ - authz-keycloak
+ - basic-auth
+ - batch-requests
+ - consumer-restriction
+ - cors
+ - echo
+ - fault-injection
+ - grpc-transcode
+ - hmac-auth
+ - http-logger
+ - ip-restriction
+ - ua-restriction
+ - jwt-auth
+ - kafka-logger
+ - key-auth
+ - limit-conn
+ - limit-count
+ - limit-req
+ - node-status
+ - openid-connect
+ - authz-casbin
+ - prometheus
+ - proxy-cache
+ - proxy-mirror
+ - proxy-rewrite
+ - redirect
+ - referer-restriction
+ - request-id
+ - request-validation
+ - response-rewrite
+ - serverless-post-function
+ - serverless-pre-function
+ - sls-logger
+ - syslog
+ - tcp-logger
+ - udp-logger
+ - uri-blocker
+ - wolf-rbac
+ - zipkin
+ - traffic-split
+ - gzip
+ - real-ip
+ #【注意】添加此插件以配合 Dashboard 展示服务信息
+ - server-info
+
+stream_plugins:
+ - mqtt-proxy
+ - ip-restriction
+ - limit-conn
+
+customPlugins:
+ enabled: true
+ luaPath: /opts/custom_plugins/?.lua
+ #【注意】如下配置保障 Prometheus 插件可对外暴露指标
+ plugins:
+ - name: prometheus
+ attrs:
+ export_addr:
+ ip: 0.0.0.0
+ port: 9091
+ configMap:
+ name: prometheus
+ mounts: []
+
+dns:
+ resolvers:
+ - 127.0.0.1
+ - 172.20.0.10
+ - 114.114.114.114
+ - 223.5.5.5
+ - 1.1.1.1
+ - 8.8.8.8
+ validity: 30
+ timeout: 5
+
+autoscaling:
+ enabled: false
+ minReplicas: 1
+ maxReplicas: 100
+ targetCPUUtilizationPercentage: 80
+ targetMemoryUtilizationPercentage: 80
+
+configurationSnippet:
+ main: ''
+ httpStart: ''
+ httpEnd: ''
+ httpSrv: ''
+ httpAdmin: ''
+ stream: ''
+
+etcd:
+ enabled: true
+ host:
+ - 'http://etcd.host:2379'
+ prefix: /apisix
+ timeout: 30
+ auth:
+ rbac:
+ enabled: false
+ user: ''
+ password: ''
+ tls:
+ enabled: false
+ existingSecret: ''
+ certFilename: ''
+ certKeyFilename: ''
+ verify: true
+ service:
+ port: 2379
+ replicaCount: 3
+
+dashboard:
+ enabled: true
+ #【注意】为 Dashboard 开启 NodePort 方便后续使用
+ service:
+ type: NodePort
+
+ingress-controller:
+ enabled: true
+ config:
+ apisix:
+ #【注意】一定要设置 gateway 所在的 namespace
+ serviceNamespace: apisix-system
+ serviceMonitor:
+ enabled: true
+ namespace: 'apisix-system'
+ interval: 15s
+```
+
+部署成功后,点击应用名称进入详情页面,可以在「资源状态」标签页下看到如下的服务部署和工作状态运行状态展示。
+
+
+
+>💡 Apache APISIX 项目另有的两个 Helm Chart 对应的默认配置参数可以分别参考:[Dashboard](https://github.com/apache/apisix-helm-chart/blob/master/charts/apisix-dashboard/values.yaml) 和 Ingress Controller 的 values.yaml。
Review comment:
Avoid using memes. Try Admonitions https://docusaurus.io/docs/next/markdown-features/admonitions .
##########
File path: website/i18n/zh/docusaurus-plugin-content-blog/2021/11/30/use-ingress-in-kubesphere.md
##########
@@ -0,0 +1,441 @@
+---
+title: "在 KubeSphere 中使用 Apache APISIX Ingress 网关接入自定义监控"
+author: "张海立"
+authorURL: "https://github.com/webup"
+authorImageURL: "https://avatars.githubusercontent.com/u/2936504?v=4"
+keywords:
+- KubeSphere
+- Apache APISIX
+- Kubenetes
+- Ingress Controller
+- 监控
+description: 本文将通过 Apache APISIX Ingress Controller 为范例,详细为大家介绍如何通过 KubeSphere 快速为 Kubernetes 集群使用不同类型的网关并进行状态监控。
+tags: [Technology]
+---
+
+> 本文将通过 Apache APISIX Ingress Controller 为范例,详细为大家介绍如何通过 KubeSphere 快速为 Kubernetes 集群使用不同类型的网关并进行状态监控。
+
+<!--truncate-->
+
+11月初,KubeSphere 发布了 3.2.0 版本,新版本为项目网关增配了整套监控及管理页面,同时引入了集群网关来提供集群层面全局的 Ingress 网关能力。
+
+为了让用户更了解如何在新版 KubeSphere 中部署使用第三方 Ingress Controller,本文将以 [Apache APISIX Ingress Controller](https://apisix.apache.org/docs/ingress-controller/getting-started/) 为例,为大家展示通过 KubeSphere 快速为 Kubernetes 集群使用不同类型的网关并进行状态监控。
+
+## 准备工作
+
+### 安装 KubeSphere
+
+安装 KubeSphere 有两种方法:
+
+1. [在 Linux 上直接安装](https://kubesphere.com.cn/docs/quick-start/all-in-one-on-linux/)
+2. [在已有 Kubernetes 中安装](https://kubesphere.com.cn/docs/quick-start/minimal-kubesphere-on-k8s/)
+
+KubeSphere 最小化安装版本已经包含了监控模块,因此不需要额外启用,可以通过「系统组件」页面中的「监控」标签页确认安装状态。
+
+
+
+### 部署 httpbin 演示应用
+
+由于需要演示网关的访问控制能力,我们必须要先有一个可以访问的应用作为网关的后台服务。这里我们使用 [httpbin.org](httpbin.org) 提供的 [kennethreitz/httpbin](https://hub.docker.com/r/kennethreitz/httpbin/) 容器应用作为演示应用。
+
+在 KubeSphere 中,我们可以先创建新的项目或使用已有的项目,进入项目页面后,选择「应用负载」下的「服务」直接创建无状态工作负载并生成配套服务。
+
+
+
+使用 [kennethreitz/httpbin](https://hub.docker.com/r/kennethreitz/httpbin/) 容器默认的 `80` 端口作为服务端口,创建完成后确保在「工作负载」和「服务」页面下都可以看到 `httpbin` 的对应条目,如下图所示。
+
+
+
+
+
+### 项目网关细节补充
+
+**项目网关**是 KubeSphere 3.0 之后上线的功能。KubeSphere 项目中的网关是一个 NGINX Ingress 控制器。KubeSphere 内置用于 HTTP 负载均衡的机制称为**应用路由**,它定义了从外部到集群服务的连接规则。如需允许从外部访问服务,用户可创建路由资源来定义 URI 路径、后端服务名称等信息。
+
+承接上文中已部署的 `httpbin` 服务项目,在「项目设置」中打开「网关设置」页面,然后执行「开启网关」操作。方便起见,直接选择 `NodePort` 作为「访问方式」即可。
+
+
+
+确定后回到网关页面,稍等片刻后刷新页面,可以得到如下图显示的部署完成状态,在这里可以看到 NodePort 默认被赋予了两个节点端口。接招我们通过右上角的「管理」按钮「查看详情」。
+
+
+
+此时我们看到的便是 3.2.0 版本关于项目/集群网关的新监控页面。下面我们就需要为 httpbin 服务创建应用路由。
+
+从「应用负载」进入「应用路由」页面,开始「创建」路由。为路由取名为 `httpbin` 后,我们指定一个方便测试的域名,并设置「路径」为 `/`, 选择「服务」`httpbin` 和「端口」`80`。
+
+
+
+
+
+直接下一步跳过高级设置后完成路由创建,可以得到如下图所示的 httpbin 应用路由项。
+
+
+
+接下来我们就可以通过项目网关的 NodePort 地址及指定域名(如这里是 http://httpbin.ui:32516) 来访问 httpbin 应用服务,随意刷新或操作一下页面的请求生成功能,再进入网关的详情页面,便可以看到在「监控」面板上已经出现了网关的一些内置的监控指标展示。
+
+
+
+#### 指定 NodePort 节点端口
+
+对于公有云环境,如果使用 NodePort 方式向外暴露访问能力,开放端口通常是有限且受控的,因此对于网关所使用的 NodePort 我们需要对它进行修改。
+
+由于网关是被 KubeSphere 统一管理的,要修改网关服务的 NodePort 需要具备访问 `kubesphere-controls-system` 的项目权限。进入该项目后,通过「应用负载」的「服务」页面即可找到命名为 `kubesphere-router-<project-namespace>` 形式且外部访问已开放 NodePort 的网关服务。NodePort 服务端口需要通过「编辑 YAML」来直接修改。
+
+
+
+## 开始使用集群网关
+
+>KubeSphere 3.2.0 开始支持集群级别的全局网关,所有项目可共用同一个网关,之前已创建的项目网关也不会受到集群网关的影响。也可以统一纳管所有项目的网关,对其进行集中管理和配置,管理员用户再也不需要切换到不同的企业空间中去配置网关了。
+
+如果您使用的是是 KubeSphere 3.2.0 版本,我们更推荐大家使用集群网关的功能来统一整个集群的应用路由。要启用集群网关也非常简单:使用具备集群管理权限的账号,进入其可管理的某个集群(如我们这里以 `default` 集群为例),在「集群设置」的「网关设置」中即可「开启网关」,同时查看「项目网关」。
+
+
+
+集群网关开启的方式以及对齐 NodePort 访问端口的修改和之前项目网关的操作基本完全一致,这里就不多赘述了。
+
+但有一点需要特别注意:集群网关开启后,已经开启的项目网关还会保留;但尚未创建网关的项目是无法再创建单独的网关的,会直接使用集群网关。
+
+下图展示了已创建网关的项目,在同时拥有项目及集群网关后,在「网关设置」页面所呈现的所有网关概览。
+
+
+
+## 快速使用 Apache APISIX Ingress Controller
+
+Apache APISIX 是一款开源的高性能、动态云原生网关,由深圳支流科技有限公司于 2019 年捐赠给 Apache 基金会,目前已成为 Apache 基金会的顶级开源项目,也是 GitHub 上最活跃的网关项目。Apache APISIX 目前已覆盖 API 网关、LB、Kubernetes Ingress、Service Mesh 等多种场景。
+
+### 如何部署
+
+首先添加 Apache APISIX Helm Chart 仓库。之后选定一个企业空间,通过「应用管理」下的「应用仓库」来添加如下一个 [Apache APISIX 的仓库](https://charts.apiseven.com)。
+
+
+
+接下来创建一个名为 `apisix-system` 的项目。进入项目页面后,选择在「应用负载」中创建「应用」的方式来部署 Apache APISIX,并选择 `apisix` 应用模版开始进行部署。
+
+
+
+>为何是直接部署 Apache APISIX 应用的 Helm Chart,而不是直接部署 Apache APISIX Ingress Controller?
+
+这是因为 Apache APISIX Ingress Controller 目前和 Apache APISIX 网关是强关联的(如下图所示),且目前通过 Apache APISIX Helm Charts 同时部署 Apache APISIX Gateway + Dashboard + Ingress Controller 是最方便的,因此本文推荐直接使用 Apache APISIX 的 Helm Chart 进行整套组件的部署。
+
+
+
+将应用命名为 `apisix` 以避免多个组件(Gateway, Dashboard, Ingress Controller)的工作负载及服务名称产生不匹配的情况;在安装步骤中编辑的「应用设置」的部分,请参照以下配置进行填写(请特别注意带有【注意】标记的注释部分的说明,其余可以按需自行编辑修改)。
+
+```shell
Review comment:
json or yaml, double check
##########
File path: website/blog/2021/11/30/use-ingress-in-kubesphere.md
##########
@@ -0,0 +1,439 @@
+---
+title: "Using Apache APISIX Ingress Gateway to access Custom Monitoring in KubeSphere"
+author: "Haili Zhang"
+authorURL: "https://github.com/webup"
+authorImageURL: "https://avatars.githubusercontent.com/u/2936504?v=4"
+keywords:
+- KubeSphere
+- Apache APISIX
+- Kubenetes
+- Ingress Controller
+- Monitor
+description: This article will take Apache APISIX Ingress Controller as an example to show you in detail how to quickly use different types of gateways and status monitoring for Kubernetes clusters through KubeSphere.
+tags: [Technology]
+---
+
+> This article will take Apache APISIX Ingress Controller as an example to show you in detail how to quickly use different types of gateways and status monitoring for Kubernetes clusters through KubeSphere.
+
+<!--truncate-->
+
+In early November, KubeSphere released version 3.2.0, which added a full set of monitoring and management pages for project gateways, and introduced cluster gateways to provide global Ingress gateway capabilities at the cluster level.
+
+To help users better understand how to deploy and use third-party Ingress Controllers in the new version of KubeSphere, this article will use the [Apache APISIX Ingress Controller](https://apisix.apache.org/docs/ingress-controller/getting-started/) as an example to show you how to quickly use different types of gateways for Kubernetes clusters with KubeSphere and perform status monitoring.
+
+## Preparation
+
+### Installing KubeSphere
+
+There are two ways to install KubeSphere.
+
+1. Install directly on [Linux](https://kubesphere.com.cn/docs/quick-start/all-in-one-on-linux/)
+2. Install on [existing Kubernetes](https://kubesphere.com.cn/docs/quick-start/minimal-kubesphere-on-k8s/)
+
+The monitoring module is already included in the minimal installation of KubeSphere, so there is no need to enable it additionally, and you can confirm the installation status via the Monitoring tab on the System Components page.
+
+
+
+### Deploying the httpbin demo application
+
+Since we need to demonstrate the access control capabilities of the gateway, we must first have an accessible application as a backend service for the gateway. Here we use the [kennethreitz/httpbin](https://hub.docker.com/r/kennethreitz/httpbin/) container application provided by [httpbin.org](httpbin.org) as our demo application.
+
+In KubeSphere, we can either create a new project or use an existing one. After entering the project page, select "Services" under "Application Loads" to directly create a stateless workload and generate a companion service.
+
+
+
+Use the default port `80` of the [kennethreitz/httpbin](https://hub.docker.com/r/kennethreitz/httpbin/) container as the service port, and make sure you can see the corresponding entry for `httpbin` under both the Workloads and Services pages after creation, as shown in the following image.
+
+
+
+
+
+### Additional Project Gateway Details
+
+The **Project Gateway** is a feature that has been live since KubeSphere 3.0. The Gateway in the KubeSphere Project is an NGINX Ingress controller. The mechanism built into KubeSphere for HTTP load balancing is called **Application Routing**, which defines the rules for connecting from the outside to the clustered service. To allow access to services from the outside, users can create routing resources to define URI paths, back-end service names, and other information.
+
+Following the `httpbin` service project deployed above, open the Gateway Settings page in Project Settings and perform the "Enable Gateway" operation. For convenience, just select `NodePort` as the "Access Method".
+
+
+
+After OK, go back to the Gateway page, wait for a moment and refresh the page, you can get the deployment completion status as shown below, where you can see that NodePort is given two node ports by default. Next, we use the "Manage" button in the upper right corner to "View Details".
+
+
+
+At this point we are looking at the new monitoring page for the project/cluster gateway in version 3.2.0. Next we need to create an application route for the httpbin service.
+
+Go to the Application Routing page from Application Load and start "creating" the route. After naming the route `httpbin`, we specify a domain name for testing purposes and set the "path" to `/`, select "service" `httpbin` and "port" `80`.
+
+
+
+
+
+After skipping the advanced settings in the next step, the route creation is completed and you can get the `httpbin` application route entry as shown in the figure below.
+
+
+
+Next, we can access the httpbin application service through the NodePort address of the project gateway and the specified domain name (e.g., http://httpbin.ui:32516 here), refresh or manipulate the request generation function of the page at will, and then enter the details page of the gateway, you can see that the "Monitoring" panel has appeared some built-in monitoring indicators.
+
+
+
+#### Specifying the NodePort Node Port
+
+For public cloud environments that use NodePort to expose access to the outside world, the open ports are usually limited and controlled, so we need to modify the NodePort used by the gateway.
+
+Since the gateway is managed by KubeSphere, to modify the NodePort of the gateway service, you need to have access to the `kubesphere-controls-system` project. Once inside the project, you can find the gateway service named `kubesphere-router-<project-namespace>` on the "Services" page under "Application Load", and the NodePort is open for external access.
+
+
+
+## Getting Started with Clustered Gateways
+
+>KubeSphere 3.2.0 supports global gateways at the cluster level, so all projects can share the same gateway, and previously created project gateways are not affected by the cluster gateway. Gateways for all projects can be managed and configured centrally, eliminating the need to switch to a different enterprise space to configure gateways.
+
+If you are using KubeSphere version 3.2.0, we recommend using the cluster gateway feature to unify the application routing across the cluster. To enable the cluster gateway, it's very simple: use an account with cluster management privileges to access one of the clusters you can manage (e.g. default cluster here), and under "Gateway Settings" in "Cluster Settings", you can "Enable Gateway" and view the "Project Gateway".
+
+
+
+The way the cluster gateway is opened and the modification of the aligned NodePort access port are basically the same as the previous project gateway, so we won't go into details here.
+
+However, there is one point that needs special attention: after the cluster gateway is opened, the gateway of the project that has been opened will remain; however, the project that has not yet created a gateway cannot create a separate gateway, and will use the cluster gateway directly.
+
+The following figure shows the overview of all gateways in the "Gateway Settings" page for projects that have already created gateways, after having both project and cluster gateways.
+
+
+
+## A Quick Look at Apache APISIX Ingress Controller
+
+Apache APISIX is an open source, high-performance, dynamic cloud-native gateway donated to the Apache Foundation by Shenzhen Tributary Technology Co. in 2019, and is now the top open source project of the Apache Foundation and the most active gateway project on GitHub.Apache APISIX currently covers API gateways, LB Kubernetes Ingress, Service Mesh, and many other scenarios.
+
+### How to deploy
+
+First add the Apache APISIX Helm Chart repository. After that, select an enterprise space and add the following [Apache APISIX repository](https://charts.apiseven.com) via "Application Repository" under "Application Management".
+
+
+
+Next, create a project named `apisix-system`. Once you are on the project page, select the Create an Application in Application Load method to deploy Apache APISIX, and select the `apisix` application template to start the deployment.
+
+
+
+>Why deploy the Apache APISIX application Helm Chart directly instead of deploying the Apache APISIX Ingress Controller directly?
+
+This is because the Apache APISIX Ingress Controller is currently strongly associated with the Apache APISIX Gateway (as shown in the figure below), and it is currently most convenient to deploy Apache APISIX Gateway + Dashboard + Ingress Controller through Apache APISIX Helm Charts at the same time. Ingress Controller is the most convenient, so this article recommends using Apache APISIX Helm Charts directly for the deployment of the whole set of components.
+
+
+
+Name the application apisix to avoid mismatches between workloads and service names of multiple components (Gateway, Dashboard, Ingress Controller); in the "Application Settings" section edited in the installation steps, please fill in the following configuration (please pay special attention to the notes marked with [Note], the rest (The rest can be edited and modified by yourself as needed).
+
+```shell
+global:
+ imagePullSecrets: []
+
+apisix:
+ enabled: true
+ customLuaSharedDicts: []
+ image:
+ repository: apache/apisix
+ pullPolicy: IfNotPresent
+ tag: 2.10.1-alpine
+ replicaCount: 1
+ podAnnotations: {}
+ podSecurityContext: {}
+ securityContext: {}
+ resources: {}
+ nodeSelector: {}
+ tolerations: []
+ affinity: {}
+ podAntiAffinity:
+ enabled: false
+
+nameOverride: ''
+fullnameOverride: ''
+
+gateway:
+ type: NodePort
+ externalTrafficPolicy: Cluster
+ http:
+ enabled: true
+ servicePort: 80
+ containerPort: 9080
+ tls:
+ enabled: false
+ servicePort: 443
+ containerPort: 9443
+ existingCASecret: ''
+ certCAFilename: ''
+ http2:
+ enabled: true
+ stream:
+ enabled: false
+ only: false
+ tcp: []
+ udp: []
+ ingress:
+ enabled: false
+ annotations: {}
+ hosts:
+ - host: apisix.local
+ paths: []
+ tls: []
+
+admin:
+ enabled: true
+ type: ClusterIP
+ externalIPs: []
+ port: 9180
+ servicePort: 9180
+ cors: true
+ credentials:
+ admin: edd1c9f034335f136f87ad84b625c8f1
+ viewer: 4054f7cf07e344346cd3f287985e76a2
+ allow:
+ ipList:
+ - 0.0.0.0/0
+
+plugins:
+ - api-breaker
+ - authz-keycloak
+ - basic-auth
+ - batch-requests
+ - consumer-restriction
+ - cors
+ - echo
+ - fault-injection
+ - grpc-transcode
+ - hmac-auth
+ - http-logger
+ - ip-restriction
+ - ua-restriction
+ - jwt-auth
+ - kafka-logger
+ - key-auth
+ - limit-conn
+ - limit-count
+ - limit-req
+ - node-status
+ - openid-connect
+ - authz-casbin
+ - prometheus
+ - proxy-cache
+ - proxy-mirror
+ - proxy-rewrite
+ - redirect
+ - referer-restriction
+ - request-id
+ - request-validation
+ - response-rewrite
+ - serverless-post-function
+ - serverless-pre-function
+ - sls-logger
+ - syslog
+ - tcp-logger
+ - udp-logger
+ - uri-blocker
+ - wolf-rbac
+ - zipkin
+ - traffic-split
+ - gzip
+ - real-ip
+ # [note] add this plug-in to cooperate with Dashboard to display service information
+ - server-info
+
+stream_plugins:
+ - mqtt-proxy
+ - ip-restriction
+ - limit-conn
+
+customPlugins:
+ enabled: true
+ luaPath: /opts/custom_plugins/?.lua
+ # [note] the following configuration ensures that the Prometheus plug-in can expose indicators to the outside world.
+ plugins:
+ - name: prometheus
+ attrs:
+ export_addr:
+ ip: 0.0.0.0
+ port: 9091
+ configMap:
+ name: prometheus
+ mounts: []
+
+dns:
+ resolvers:
+ - 127.0.0.1
+ - 172.20.0.10
+ - 114.114.114.114
+ - 223.5.5.5
+ - 1.1.1.1
+ - 8.8.8.8
+ validity: 30
+ timeout: 5
+
+autoscaling:
+ enabled: false
+ minReplicas: 1
+ maxReplicas: 100
+ targetCPUUtilizationPercentage: 80
+ targetMemoryUtilizationPercentage: 80
+
+configurationSnippet:
+ main: ''
+ httpStart: ''
+ httpEnd: ''
+ httpSrv: ''
+ httpAdmin: ''
+ stream: ''
+
+etcd:
+ enabled: true
+ host:
+ - 'http://etcd.host:2379'
+ prefix: /apisix
+ timeout: 30
+ auth:
+ rbac:
+ enabled: false
+ user: ''
+ password: ''
+ tls:
+ enabled: false
+ existingSecret: ''
+ certFilename: ''
+ certKeyFilename: ''
+ verify: true
+ service:
+ port: 2379
+ replicaCount: 3
+
+dashboard:
+ enabled: true
+ # [note] Enable NodePort for Dashboard to facilitate subsequent use
+ service:
+ type: NodePort
+
+ingress-controller:
+ enabled: true
+ config:
+ apisix:
+ # [note] Be sure to set the namespace where gateway is located
+ serviceNamespace: apisix-system
+ serviceMonitor:
+ enabled: true
+ namespace: 'apisix-system'
+ interval: 15s
+```
+
+After successful deployment, click the application name to enter the details page, and you can see the following service deployment and working status operation status display under the "Resource Status" tab.
+
+
+
+>💡 The default configuration parameters for the other two Helm Charts of the Apache APISIX project can be found in [Dashboard](https://github.com/apache/apisix-helm-chart/blob/master/charts/apisix-dashboard/values.yaml) and [Ingress Controller](https://github.com/apache/apisix-helm-chart/blob/master/charts/apisix-ingress-controller/values.yaml) `values.yaml`.
Review comment:
Avoid using memes.
```suggestion
:::note Note
The default configuration parameters for the other two Helm Charts of the Apache APISIX project can be found in [Dashboard](https://github.com/apache/apisix-helm-chart/blob/master/charts/apisix-dashboard/values.yaml) and [Ingress Controller](https://github.com/apache/apisix-helm-chart/blob/master/charts/apisix-ingress-controller/values.yaml) `values.yaml`.
:::
```
--
This is an automated message from the Apache Git Service.
To respond to the message, please log on to GitHub and use the
URL above to go to the specific comment.
To unsubscribe, e-mail: notifications-unsubscribe@apisix.apache.org
For queries about this service, please contact Infrastructure at:
users@infra.apache.org