You are viewing a plain text version of this content. The canonical link for it is here.
Posted to notifications@shardingsphere.apache.org by zh...@apache.org on 2022/07/03 05:47:01 UTC
[shardingsphere] branch master updated: Update documents for observability. (#18802)
This is an automated email from the ASF dual-hosted git repository.
zhangliang pushed a commit to branch master
in repository https://gitbox.apache.org/repos/asf/shardingsphere.git
The following commit(s) were added to refs/heads/master by this push:
new 01186cf8d34 Update documents for observability. (#18802)
01186cf8d34 is described below
commit 01186cf8d345870240f2a6fefff33197f340f853
Author: Raigor <ra...@gmail.com>
AuthorDate: Sun Jul 3 13:46:54 2022 +0800
Update documents for observability. (#18802)
* Update documents for observability.
* Fix title.
* Change plug-in to plugin.
---
.../content/features/observability/_index.cn.md | 57 ++++++++------------
.../content/features/observability/_index.en.md | 58 +++++++++------------
docs/document/static/img/apm/overview_v3.png | Bin 88455 -> 0 bytes
docs/document/static/img/apm/overview_v4.png | Bin 0 -> 88683 bytes
4 files changed, 49 insertions(+), 66 deletions(-)
diff --git a/docs/document/content/features/observability/_index.cn.md b/docs/document/content/features/observability/_index.cn.md
index 9f32605d81d..7bebc14f682 100644
--- a/docs/document/content/features/observability/_index.cn.md
+++ b/docs/document/content/features/observability/_index.cn.md
@@ -2,52 +2,41 @@
pre = "<b>4.11. </b>"
title = "可观察性"
weight = 11
-chapter = true
+++
-## 背景
-
+## 定义
如何观测集群的运行状态,使运维人员可以快速掌握当前系统现状,并进行进一步的维护工作,是分布式系统的全新挑战。
登录到具体服务器的点对点运维方式,无法适用于面向大量分布式服务器的场景。
通过对可系统观察性数据的遥测是分布式系统推荐的运维方式。
-Tracing(链路跟踪)、 Metrics(指标监控)和 Logging (日志)是系统运行状况的可观察性数据重要的获取手段。
-
-APM(应用性能监控)
-是通过对系统可观察性数据进行采集、存储和分析,进行系统的性能监控与诊断,主要功能包括性能指标监控、调用链分析,应用拓扑图等。
-
-Apache ShardingSphere 并不负责如何采集、存储以及展示应用性能监控的相关数据,而是为应用监控系统提供必要的指标数据。
-换句话说,Apache ShardingSphere 仅负责产生具有价值的数据,并通过标准协议或插件化的方式递交给相关系统。
-
-Tracing 用于获取 SQL 解析与 SQL 执行的链路跟踪信息。Apache ShardingSphere 默认提供了对 SkyWalking,Zipkin,Jaeger 和 OpenTelemetry 的支持,也支持用户通过插件化的方式开发自定义的 Tracing 组件。
-
-- 使用 Zipkin 和 Jaeger
-
-通过在agent配置文件中开启对应的插件,并配置好 Zipkin 或者 Jaeger 服务器信息即可。
-
-- 使用 OpenTelemetry
-
-OpenTelemetry 在 2019 年由 OpenTracing 和 OpenCencus 合并而来。
-使用这种方式,只需要在 agent 配置文件中,根据 [OpenTelemetry SDK 自动配置说明](https://github.com/open-telemetry/opentelemetry-java/tree/main/sdk-extensions/autoconfigure) ,填写合适的配置即可。
-- 使用 SkyWalking
-
-需要在 agent 配置中配置启用对应插件,并且需要同时配置使用 SkyWalking 的 apm-toolkit 工具。
+## 相关概念
-- 使用 SkyWalking 的内置自动探针
+### Agent
+基于字节码增强和插件化设计,以提供 Tracing 和 Metrics 埋点,以及日志输出功能。
+需要开启 Agent 的插件功能后,才能将监控指标数据输出至第三方 APM 中展示。
-[Apache ShardingSphere](https://shardingsphere.apache.org) 团队与 [Apache SkyWalking](https://skywalking.apache.org) 团队共同合作,在 SkyWalking 中实现了 Apache ShardingSphere 自动探针,可以将相关的应用性能数据自动发送到 SkyWalking 中。注意这种方式的自动探针不能与 Apache ShardingSphere 插件探针同时使用。
+### APM
+APM 是应用性能监控的缩写。
+着眼于分布式系统的性能诊断,其主要功能包括调用链展示,应用拓扑分析等。
-Metrics 则用于收集和展示整个集群的统计指标。Apache ShardingSphere 默认提供了对 Prometheus 的支持。
+### Tracing
+链路跟踪,通过探针收集调用链数据,并发送到第三方 APM 系统。
-
+### Metrics
+系统统计指标,通过探针收集,并且写入到时序数据库,供第三方应用展示。
-## 挑战
+### Logging
+日志,通过 Agent 能够方便的扩展日志内容,为分析系统运行状态提供更多信息。
-Tracing 和 Metrics 需要通过埋点来收集系统信息。
-大量的埋点使项目核心代码支离破碎,难于维护,且不易定制化统计指标。
+ ## 原理介绍
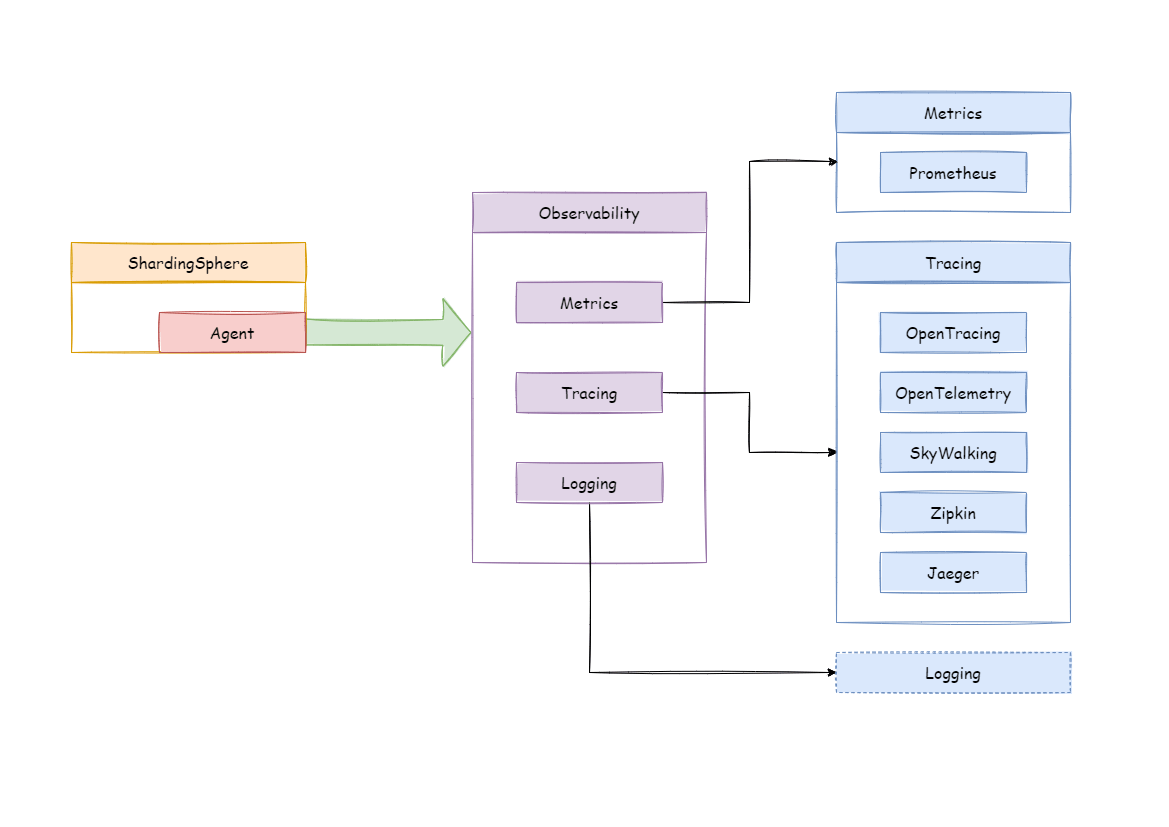
+ShardingSphere-Agent 模块为 ShardingSphere 提供了可观察性的框架,它是基于 Java Agent 技术实现的。
+Metrics、Tracing 和 Logging 等功能均通过插件的方式集成在 Agent 中,如图:
-## 目标
+
-**提供尽量多的性能和统计指标,并隔离核心代码和埋点代码,是 Apache ShardingSphere 可观察性模块的设计目标。**
+- Metrics 插件用于收集和展示整个集群的统计指标。Apache ShardingSphere 默认提供了对 Prometheus 的支持。
+- Tracing 插件用于获取 SQL 解析与 SQL 执行的链路跟踪信息。Apache ShardingSphere 默认提供了对 Jaeger、OpenTelemetry、OpenTracing(SkyWalking)和 Zipkin 的支持,也支持用户通过插件化的方式开发自定义的 Tracing 组件。
+- 默认的 Logging 插件展示了如何在 ShardingSphere 中记录额外的日志,实际应用中需要用户根据自己的需求进行探索。
-**源码:https://github.com/apache/shardingsphere/tree/master/shardingsphere-agent**
+## 相关参考
+[特殊 API:可观察性](/cn/user-manual/shardingsphere-jdbc/special-api/observability/)
diff --git a/docs/document/content/features/observability/_index.en.md b/docs/document/content/features/observability/_index.en.md
index 2b6901ca61e..93f9a24632c 100644
--- a/docs/document/content/features/observability/_index.en.md
+++ b/docs/document/content/features/observability/_index.en.md
@@ -2,52 +2,46 @@
pre = "<b>4.11. </b>"
title = "Observability"
weight = 11
-chapter = true
+++
-## Background
+## Definition
+Observing a cluster's operation status in order to quickly grasp the system's current status and efficiently be able to carry out maintenance work, represents a new challenge for distributed systems.
-In order to grasp the distributed system status, observe running state of the cluster is a new challenge.
-The point-to-point operation mode of logging in to a specific server cannot suite to large number of distributed servers.
-Telemetry through observable data is the recommended operation and maintenance mode for them.
-Tracking, metrics and logging are important ways to obtain observable data of system status.
+The point-to-point operation and maintenance method of logging into a specific server cannot be applied to scenarios facing a large number of distributed servers.
-APM (application performance monitoring) is to monitor and diagnose the performance of the system by collecting, storing and analyzing the observable data of the system. Its main functions include performance index monitoring, call stack analysis, service topology, etc.
+Telemetry of system-observable data is the recommended way of operating and maintaining distributed systems.
-Apache ShardingSphere is not responsible for gathering, storing and demonstrating APM data, but provides the necessary information for the APM.
-In other words, Apache ShardingSphere is only responsible for generating valuable data and submitting it to relevant systems through standard protocols or plug-ins.
-Tracing is to obtain the tracking information of SQL parsing and SQL execution. Apache ShardingSphere provides support for SkyWalking, Zipkin, Jaeger and OpenTelemetry by default. It also supports users to develop customized components through plug-in.
+## Related Concepts
-- Use Zipkin or Jaeger
+### Agent
+Based on bytecode enhancement and plugin design to provide tracing, metrics and logging features.
-Just provides correct Zipkin or Jaeger server information in the agent configuration file.
+Only after the plugin of the Agent is enabled, the monitoring indicator data can be output to the third-party APM for display.
-- Use OpenTelemetry
+### APM
+APM is an acronym for Application Performance Monitoring.
-OpenTelemetry was merged by OpenTracing and OpenCencus in 2019.
-In this way, you only need to fill in the appropriate configuration in the agent configuration file according to [OpenTelemetry SDK Autoconfigure Guide](https://github.com/open-telemetry/opentelemetry-java/tree/main/sdk-extensions/autoconfigure).
+Focusing on the performance diagnosis of distributed systems, its main functions include call chain display, application topology analysis, etc.
-- Use SkyWalking
+### Tracing
+Tracing data between distributed services or internal processes will be collected by agent. It will then be sent to third-party APM systems.
-Enable the SkyWalking plug-in in configuration file and need to configure the SkyWalking apm-toolkit.
+### Metrics
+System statistical indicators are collected through probes and written to the time series database for display by third-party applications.
-- Use SkyWalking's automatic monitor probe
+### Logging
+The log can be easily expanded through the agent to provide more information for analyzing the system running status.
-Cooperating with [Apache SkyWalking](https://skywalking.apache.org/) team,
-Apache ShardingSphere team has realized `ShardingSphere` automatic monitor probe to automatically send performance data to `SkyWalking`. Note that automatic probe in this way cannot be used together with Apache ShardingSphere plug-in probe.
+## How it works
+ShardingSphere-Agent module provides an observable framework for ShardingSphere, which is implemented based on Java Agent.
-Metrics used to collect and display statistical indicator of cluster.
-Apache ShardingSphere supports Prometheus by default.
+Metrics, tracing and logging functions are integrated into the agent through plugins, as shown in the following figure:
-
+
-## Challenges
+- The Metrics plugin is used to collect and display statistical indicators for the entire cluster. Apache ShardingSphere supports Prometheus by default.
+- The tracing plugin is used to obtain the link trace information of SQL parsing and SQL execution. Apache ShardingSphere provides support for Jaeger, OpenTelemetry, OpenTracing(SkyWalking) and Zipkin by default. It also supports users developing customized tracing components through plugin.
+- The default logging plugin shows how to record additional logs in ShardingSphere. In practical applications, users need to explore according to their own needs.
-Tracing and metrics need to collect system information through event tracking.
-Lots of events tracking make kernel code mess, difficult to maintain, and difficult to customize extend.
-
-## Goal
-
-**The goal of Apache ShardingSphere observability module is providing as many performance and statistical indicators as possible and isolating kernel code and embedded code.**
-
-**Source Codes: https://github.com/apache/shardingsphere/tree/master/shardingsphere-agent**
+## Related References
+[Special API: Observability](/en/user-manual/shardingsphere-jdbc/special-api/observability/)
diff --git a/docs/document/static/img/apm/overview_v3.png b/docs/document/static/img/apm/overview_v3.png
deleted file mode 100644
index 6a6492c49a8..00000000000
Binary files a/docs/document/static/img/apm/overview_v3.png and /dev/null differ
diff --git a/docs/document/static/img/apm/overview_v4.png b/docs/document/static/img/apm/overview_v4.png
new file mode 100644
index 00000000000..80fcc7b9516
Binary files /dev/null and b/docs/document/static/img/apm/overview_v4.png differ