You are viewing a plain text version of this content. The canonical link for it is here.
Posted to commits@iotdb.apache.org by qi...@apache.org on 2024/04/01 06:40:51 UTC
(iotdb-docs) branch main updated: Add docs for explain/explain analyze (#197)
This is an automated email from the ASF dual-hosted git repository.
qiaojialin pushed a commit to branch main
in repository https://gitbox.apache.org/repos/asf/iotdb-docs.git
The following commit(s) were added to refs/heads/main by this push:
new cdcb1db Add docs for explain/explain analyze (#197)
cdcb1db is described below
commit cdcb1db70bf93965401fa3dfe404b9f56180d156
Author: YangCaiyin <yc...@gmail.com>
AuthorDate: Mon Apr 1 14:40:45 2024 +0800
Add docs for explain/explain analyze (#197)
---
src/.vuepress/sidebar/V1.3.x/en.ts | 1 +
src/.vuepress/sidebar/V1.3.x/zh.ts | 1 +
src/.vuepress/sidebar_timecho/V1.3.x/en.ts | 1 +
src/.vuepress/sidebar_timecho/V1.3.x/zh.ts | 1 +
src/UserGuide/Master/SQL-Manual/SQL-Manual.md | 9 +
src/UserGuide/Master/User-Manual/Maintennance.md | 239 +++++++++++++++++++++
src/UserGuide/latest/SQL-Manual/SQL-Manual.md | 10 +-
src/UserGuide/latest/User-Manual/Maintennance.md | 239 +++++++++++++++++++++
src/zh/UserGuide/Master/SQL-Manual/SQL-Manual.md | 10 +-
.../UserGuide/Master/User-Manual/Maintennance.md | 236 ++++++++++++++++++++
src/zh/UserGuide/latest/SQL-Manual/SQL-Manual.md | 11 +-
.../UserGuide/latest/User-Manual/Maintennance.md | 236 ++++++++++++++++++++
12 files changed, 990 insertions(+), 4 deletions(-)
diff --git a/src/.vuepress/sidebar/V1.3.x/en.ts b/src/.vuepress/sidebar/V1.3.x/en.ts
index b68201a..3b6d283 100644
--- a/src/.vuepress/sidebar/V1.3.x/en.ts
+++ b/src/.vuepress/sidebar/V1.3.x/en.ts
@@ -89,6 +89,7 @@ export const enSidebar = {
{ text: 'Data Sync', link: 'Data-Sync' },
{ text: 'Database Programming', link: 'Database-Programming' },
{ text: 'Authority Management', link: 'Authority-Management' },
+ { text: 'Maintennance', link: 'Maintennance' },
],
},
{
diff --git a/src/.vuepress/sidebar/V1.3.x/zh.ts b/src/.vuepress/sidebar/V1.3.x/zh.ts
index 57c071c..33118b7 100644
--- a/src/.vuepress/sidebar/V1.3.x/zh.ts
+++ b/src/.vuepress/sidebar/V1.3.x/zh.ts
@@ -88,6 +88,7 @@ export const zhSidebar = {
{ text: '数据同步', link: 'Data-Sync' },
{ text: '数据库编程', link: 'Database-Programming' },
{ text: '权限管理', link: 'Authority-Management' },
+ { text: '运维语句', link: 'Maintennance' },
],
},
{
diff --git a/src/.vuepress/sidebar_timecho/V1.3.x/en.ts b/src/.vuepress/sidebar_timecho/V1.3.x/en.ts
index 1f2d937..d3927dc 100644
--- a/src/.vuepress/sidebar_timecho/V1.3.x/en.ts
+++ b/src/.vuepress/sidebar_timecho/V1.3.x/en.ts
@@ -93,6 +93,7 @@ export const enSidebar = {
{ text: 'Database Programming', link: 'Database-Programming' },
{ text: 'Security Management', link: 'Security-Management_timecho' },
{ text: 'Authority Management', link: 'Authority-Management' },
+ { text: 'Maintennance', link: 'Maintennance' },
],
},
{
diff --git a/src/.vuepress/sidebar_timecho/V1.3.x/zh.ts b/src/.vuepress/sidebar_timecho/V1.3.x/zh.ts
index df4e412..b34851d 100644
--- a/src/.vuepress/sidebar_timecho/V1.3.x/zh.ts
+++ b/src/.vuepress/sidebar_timecho/V1.3.x/zh.ts
@@ -93,6 +93,7 @@ export const zhSidebar = {
{ text: '数据库编程', link: 'Database-Programming' },
{ text: '安全控制', link: 'Security-Management_timecho' },
{ text: '权限管理', link: 'Authority-Management' },
+ { text: '运维语句', link: 'Maintennance' },
],
},
{
diff --git a/src/UserGuide/Master/SQL-Manual/SQL-Manual.md b/src/UserGuide/Master/SQL-Manual/SQL-Manual.md
index 8d3f4d0..16bacec 100644
--- a/src/UserGuide/Master/SQL-Manual/SQL-Manual.md
+++ b/src/UserGuide/Master/SQL-Manual/SQL-Manual.md
@@ -907,6 +907,15 @@ IoTDB > select * into ::(backup_${4}) from root.sg.** align by device;
IoTDB > select s1, s2 into root.sg_copy.d1(t1, t2), aligned root.sg_copy.d2(t1, t2) from root.sg.d1, root.sg.d2 align by device;
```
+## Maintennance
+Generate the corresponding query plan:
+```
+explain select s1,s2 from root.sg.d1
+```
+Execute the corresponding SQL, analyze the execution and output:
+```
+explain analyze select s1,s2 from root.sg.d1 order by s1
+```
## OPERATOR
For more details, see document [Operator-and-Expression](../User-Manual/Operator-and-Expression.md).
diff --git a/src/UserGuide/Master/User-Manual/Maintennance.md b/src/UserGuide/Master/User-Manual/Maintennance.md
new file mode 100644
index 0000000..79e3149
--- /dev/null
+++ b/src/UserGuide/Master/User-Manual/Maintennance.md
@@ -0,0 +1,239 @@
+<!--
+
+ Licensed to the Apache Software Foundation (ASF) under one
+ or more contributor license agreements. See the NOTICE file
+ distributed with this work for additional information
+ regarding copyright ownership. The ASF licenses this file
+ to you under the Apache License, Version 2.0 (the
+ "License"); you may not use this file except in compliance
+ with the License. You may obtain a copy of the License at
+
+ http://www.apache.org/licenses/LICENSE-2.0
+
+ Unless required by applicable law or agreed to in writing,
+ software distributed under the License is distributed on an
+ "AS IS" BASIS, WITHOUT WARRANTIES OR CONDITIONS OF ANY
+ KIND, either express or implied. See the License for the
+ specific language governing permissions and limitations
+ under the License.
+
+-->
+
+# Maintennance
+## Overview
+
+The significance of query analysis lies in assisting users to understand the execution mechanism and performance bottlenecks of queries, thereby achieving query optimization and performance improvement. This concerns not only the efficiency of query execution but also directly affects the user experience of applications and the effective use of resources. To conduct effective query analysis, IoTDB provides query analysis tools: Explain and Explain Analyze.
+
+The Explain tool allows users to preview the execution plan of a query SQL, including how IoTDB organizes data retrieval and processing.
+
+Explain Analyze goes further by adding performance analysis, fully executing the SQL and displaying the time and resources consumed during the execution of the query. It provides detailed information for IoTDB users to deeply understand query details and perform query optimization.
+### Explain
+The Explain command allows users to view the execution plan of an SQL query. The execution plan is presented in the form of operators, describing how IoTDB will execute the query. The output of Explain includes information such as data access strategies, whether filter conditions are pushed down, and the distribution of the query plan across different nodes, providing users with a means to visualize the internal logic of the query execution. Its syntax is as follows:
+
+```sql
+EXPLAIN <SELECT_STATEMENT>
+```
+Where SELECT_STATEMENT is the SQL statement related to the query. An example of usage is as follows:
+```sql
+insert into root.explain.data(timestamp, column1, column2) values(1710494762, "hello", "explain")
+
+explain select * from root.explain.data
+```
+Execute the SQL and get the following result:
+```
++-----------------------------------------------------------------------+
+| distribution plan|
++-----------------------------------------------------------------------+
+| ┌───────────────────┐ |
+| │FullOuterTimeJoin-3│ |
+| │Order: ASC │ |
+| └───────────────────┘ |
+| ┌─────────────────┴─────────────────┐ |
+| │ │ |
+|┌─────────────────────────────────┐ ┌─────────────────────────────────┐|
+|│SeriesScan-4 │ │SeriesScan-5 │|
+|│Series: root.explain.data.column1│ │Series: root.explain.data.column2│|
+|│Partition: 3 │ │Partition: 3 │|
+|└─────────────────────────────────┘ └─────────────────────────────────┘|
++-----------------------------------------------------------------------+
+```
+It can be seen that IoTDB retrieves the data for column1 and column2 through two separate SeriesScan nodes, and finally connects them using fullOuterTimeJoin.
+### Explain Analyze
+Explain Analyze is a performance analysis SQL built into the IoTDB query engine. Unlike Explain, it executes the corresponding query plan and collects execution information. It can be used to track the specific performance distribution of a query, observe resources, and conduct performance tuning and anomaly analysis.
+
+Compared to other analysis methods where can be attached in IoTDB, Explain Analyze does not require deployment effort and can analyze individual SQL statements, allowing for more precise problem identification:
+
+|Method|Installation Difficulty|Impact on Business|Supports Distributed System|Analysis of Individual SQL|
+|:----|:----|:----|:----|:----|
+|Arthas Sampling|Requires downloading and running files on the machine: some internal networks cannot directly install Arthas; and sometimes, it requires restarting the application after installation|CPU sampling may affect the response speed of online business|No|Online businesses usually have various query loads, and the overall monitoring metrics and sampling results can only reflect the overall load and response times of all queries, unable to analyze the response time of individual [...]
+|Monitor Tool|Requires enabling monitoring services or deploying Grafana, and open-source users do not have a monitoring dashboard|Recording metrics will bring additional response time|Yes| Same as Arthas|
+|Explain Analyze|No installation required, available upon starting IoTDB|Only affects the single query being analyzed, with no impact on other online loads|Yes|Allows for tracking and analysis of individual SQL statements|
+
+Its syntax is as following:
+```sql
+EXPLAIN ANALYZE [VERBOSE] <SELECT_STATEMENT>
+```
+In it, SELECT_STATEMENT corresponds to the query statement to be analyzed. By default, in order to simplify the results as much as possible, EXPLAIN ANALYZE will omit some information. Specifying VERBOSE can be used to output this information.
+
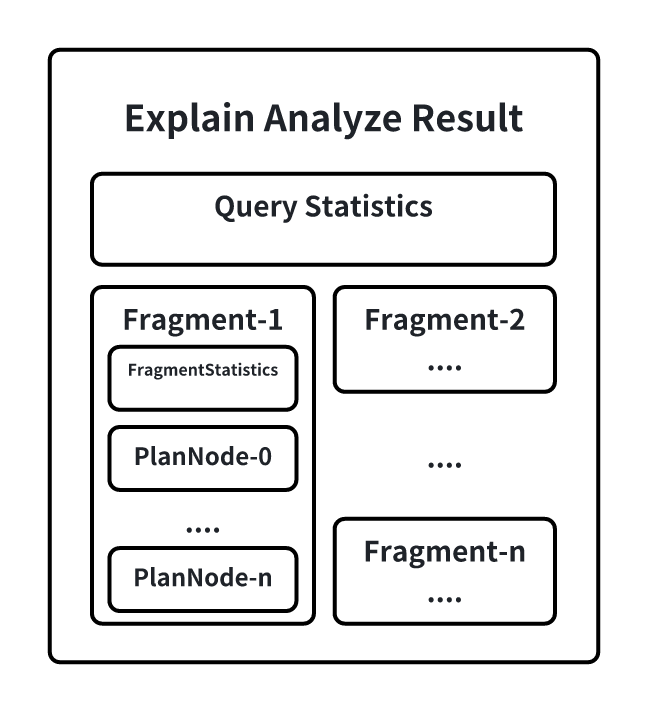
+The result set of EXPLAIN ANALYZE will include the following information:
+
+
+
+QueryStatistics contains the statistical information at the query level, primarily including the time consumed during the plan parsing phase, Fragment metadata, and other information.
+
+FragmentInstance is IoTDB's encapsulation of a query plan on a node. Each node will output a Fragment information in the result set, mainly including FragmentStatistics and operator information.
+
+FragmentStatistics includes the statistical information of a Fragment, such as the total actual duration (wall-clock time), the TsFiles involved, scheduling information, etc. The information of a Fragment is also displayed in a tree hierarchy of plan nodes within that Fragment, including:
+* CPU runtime
+* Number of output rows
+* Number of times a specific interface is called
+* Memory usage
+* Node-specific custom information
+
+Below is an example of Explain Analyze:
+
+```sql
+insert into root.explain.analyze.data(timestamp, column1, column2, column3) values(1710494762, "hello", "explain", "analyze")
+insert into root.explain.analyze.data(timestamp, column1, column2, column3) values(1710494862, "hello2", "explain2", "analyze2")
+insert into root.explain.analyze.data(timestamp, column1, column2, column3) values(1710494962, "hello3", "explain3", "analyze3")
+explain analyze select column2 from root.explain.analyze.data order by column1
+```
+Get result following:
+```
++-------------------------------------------------------------------------------------------------+
+| Explain Analyze|
++-------------------------------------------------------------------------------------------------+
+|Analyze Cost: 1.739 ms |
+|Fetch Partition Cost: 0.940 ms |
+|Fetch Schema Cost: 0.066 ms |
+|Logical Plan Cost: 0.000 ms |
+|Logical Optimization Cost: 0.000 ms |
+|Distribution Plan Cost: 0.000 ms |
+|Fragment Instances Count: 1 |
+| |
+|FRAGMENT-INSTANCE[Id: 20240315_115800_00030_1.2.0][IP: 127.0.0.1][DataRegion: 4][State: FINISHED]|
+| Total Wall Time: 25 ms |
+| Cost of initDataQuerySource: 0.175 ms |
+| Seq File(unclosed): 0, Seq File(closed): 1 |
+| UnSeq File(unclosed): 0, UnSeq File(closed): 0 |
+| ready queued time: 0.280 ms, blocked queued time: 2.456 ms |
+| [PlanNodeId 10]: IdentitySinkNode(IdentitySinkOperator) |
+| CPU Time: 0.780 ms |
+| output: 1 rows |
+| HasNext() Called Count: 3 |
+| Next() Called Count: 2 |
+| Estimated Memory Size: : 1245184 |
+| [PlanNodeId 5]: TransformNode(TransformOperator) |
+| CPU Time: 0.764 ms |
+| output: 1 rows |
+| HasNext() Called Count: 3 |
+| Next() Called Count: 2 |
+| Estimated Memory Size: : 1245184 |
+| [PlanNodeId 4]: SortNode(SortOperator) |
+| CPU Time: 0.721 ms |
+| output: 1 rows |
+| HasNext() Called Count: 3 |
+| Next() Called Count: 2 |
+| sortCost/ns: 1125 |
+| sortedDataSize: 272 |
+| prepareCost/ns: 610834 |
+| [PlanNodeId 3]: FullOuterTimeJoinNode(FullOuterTimeJoinOperator) |
+| CPU Time: 0.706 ms |
+| output: 1 rows |
+| HasNext() Called Count: 5 |
+| Next() Called Count: 1 |
+| [PlanNodeId 7]: SeriesScanNode(SeriesScanOperator) |
+| CPU Time: 1.085 ms |
+| output: 1 rows |
+| HasNext() Called Count: 2 |
+| Next() Called Count: 1 |
+| SeriesPath: root.explain.analyze.data.column2 |
+| [PlanNodeId 8]: SeriesScanNode(SeriesScanOperator) |
+| CPU Time: 1.091 ms |
+| output: 1 rows |
+| HasNext() Called Count: 2 |
+| Next() Called Count: 1 |
+| SeriesPath: root.explain.analyze.data.column1 |
++-------------------------------------------------------------------------------------------------+
+```
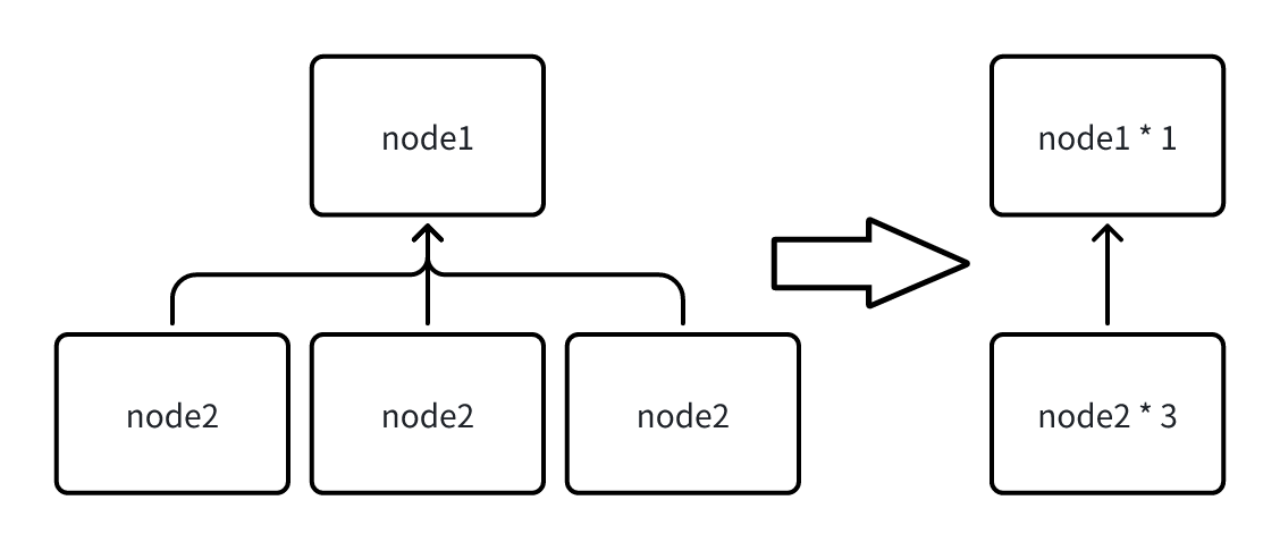
+#### PlanNode Compaction in the Result Of EXPLAIN ANALYZE
+
+
+
+
+In a Fragment, the information of all nodes executed in the current node will be output. However, when a query involves too many series, outputting each seriesScanNode can lead to an excessively large result set from Explain Analyze. Therefore, when the same type of nodes exceeds 10, all nodes of the same type under the current Fragment will be merged. The statistical information is also accumulated after the merge, and some customized information that cannot be merged will be directly d [...]
+
+The threshold for triggering the merge of nodes can be set by modifying the configuration item `merge_threshold_of_explain_analyze` in iotdb-common.properties, and this parameter supports hot loading. Below is a part of the result example after triggering a merge:
+
+```
+Analyze Cost: 143.679 ms
+Fetch Partition Cost: 22.023 ms
+Fetch Schema Cost: 63.086 ms
+Logical Plan Cost: 0.000 ms
+Logical Optimization Cost: 0.000 ms
+Distribution Plan Cost: 0.000 ms
+Fragment Instances Count: 2
+
+FRAGMENT-INSTANCE[Id: 20240311_041502_00001_1.2.0][IP: 192.168.130.9][DataRegion: 14]
+ Total Wall Time: 39964 ms
+ Cost of initDataQuerySource: 1.834 ms
+ Seq File(unclosed): 0, Seq File(closed): 3
+ UnSeq File(unclosed): 0, UnSeq File(closed): 0
+ ready queued time: 504.334 ms, blocked queued time: 25356.419 ms
+ [PlanNodeId 20793]: IdentitySinkNode(IdentitySinkOperator) Count: * 1
+ CPU Time: 24440.724 ms
+ input: 71216 rows
+ HasNext() Called Count: 35963
+ Next() Called Count: 35962
+ Estimated Memory Size: : 33882112
+ [PlanNodeId 10385]: FullOuterTimeJoinNode(FullOuterTimeJoinOperator) Count: * 8
+ CPU Time: 41437.708 ms
+ input: 243011 rows
+ HasNext() Called Count: 41965
+ Next() Called Count: 41958
+ Estimated Memory Size: : 33882112
+ [PlanNodeId 11569]: SeriesScanNode(SeriesScanOperator) Count: * 1340
+ CPU Time: 1397.822 ms
+ input: 134000 rows
+ HasNext() Called Count: 2353
+ Next() Called Count: 1340
+ Estimated Memory Size: : 32833536
+ [PlanNodeId 20778]: ExchangeNode(ExchangeOperator) Count: * 7
+ CPU Time: 109.245 ms
+ input: 71891 rows
+ HasNext() Called Count: 1431
+ Next() Called Count: 1431
+
+FRAGMENT-INSTANCE[Id: 20240311_041502_00001_1.3.0][IP: 192.168.130.9][DataRegion: 11]
+ Total Wall Time: 39912 ms
+ Cost of initDataQuerySource: 15.439 ms
+ Seq File(unclosed): 0, Seq File(closed): 2
+ UnSeq File(unclosed): 0, UnSeq File(closed): 0
+ ready queued time: 152.988 ms, blocked queued time: 37775.356 ms
+ [PlanNodeId 20786]: IdentitySinkNode(IdentitySinkOperator) Count: * 1
+ CPU Time: 2020.258 ms
+ input: 48800 rows
+ HasNext() Called Count: 978
+ Next() Called Count: 978
+ Estimated Memory Size: : 42336256
+ [PlanNodeId 20771]: FullOuterTimeJoinNode(FullOuterTimeJoinOperator) Count: * 8
+ CPU Time: 5255.307 ms
+ input: 195800 rows
+ HasNext() Called Count: 2455
+ Next() Called Count: 2448
+ Estimated Memory Size: : 42336256
+ [PlanNodeId 11867]: SeriesScanNode(SeriesScanOperator) Count: * 1680
+ CPU Time: 1248.080 ms
+ input: 168000 rows
+ HasNext() Called Count: 3198
+ Next() Called Count: 1680
+ Estimated Memory Size: : 41287680
+
+......
+```
+
+
+#### Query Timeout Handling
+Explain Analyze is a unique type of query. When it times out, we are unable to obtain the analysis results from the return. To address this, allowing for the investigation of timeout reasons through analysis results even in cases of timeout, Explain Analyze offers a timed logging mechanism. After certain intervals, the current results of Explain Analyze are output in text form to a dedicated log file. This way, when a query times out, one can go to the logs to investigate the correspondi [...]
+
+The logging interval is calculated based on the query's timeout setting, ensuring that there are at least two records of results in case of a timeout.
\ No newline at end of file
diff --git a/src/UserGuide/latest/SQL-Manual/SQL-Manual.md b/src/UserGuide/latest/SQL-Manual/SQL-Manual.md
index 8d3f4d0..553d89c 100644
--- a/src/UserGuide/latest/SQL-Manual/SQL-Manual.md
+++ b/src/UserGuide/latest/SQL-Manual/SQL-Manual.md
@@ -906,7 +906,15 @@ IoTDB > select * into ::(backup_${4}) from root.sg.** align by device;
IoTDB > select s1, s2 into root.sg_copy.d1(t1, t2), aligned root.sg_copy.d2(t1, t2) from root.sg.d1, root.sg.d2 align by device;
```
-
+## Maintennance
+Generate the corresponding query plan:
+```
+explain select s1,s2 from root.sg.d1
+```
+Execute the corresponding SQL, analyze the execution and output:
+```
+explain analyze select s1,s2 from root.sg.d1 order by s1
+```
## OPERATOR
For more details, see document [Operator-and-Expression](../User-Manual/Operator-and-Expression.md).
diff --git a/src/UserGuide/latest/User-Manual/Maintennance.md b/src/UserGuide/latest/User-Manual/Maintennance.md
new file mode 100644
index 0000000..79e3149
--- /dev/null
+++ b/src/UserGuide/latest/User-Manual/Maintennance.md
@@ -0,0 +1,239 @@
+<!--
+
+ Licensed to the Apache Software Foundation (ASF) under one
+ or more contributor license agreements. See the NOTICE file
+ distributed with this work for additional information
+ regarding copyright ownership. The ASF licenses this file
+ to you under the Apache License, Version 2.0 (the
+ "License"); you may not use this file except in compliance
+ with the License. You may obtain a copy of the License at
+
+ http://www.apache.org/licenses/LICENSE-2.0
+
+ Unless required by applicable law or agreed to in writing,
+ software distributed under the License is distributed on an
+ "AS IS" BASIS, WITHOUT WARRANTIES OR CONDITIONS OF ANY
+ KIND, either express or implied. See the License for the
+ specific language governing permissions and limitations
+ under the License.
+
+-->
+
+# Maintennance
+## Overview
+
+The significance of query analysis lies in assisting users to understand the execution mechanism and performance bottlenecks of queries, thereby achieving query optimization and performance improvement. This concerns not only the efficiency of query execution but also directly affects the user experience of applications and the effective use of resources. To conduct effective query analysis, IoTDB provides query analysis tools: Explain and Explain Analyze.
+
+The Explain tool allows users to preview the execution plan of a query SQL, including how IoTDB organizes data retrieval and processing.
+
+Explain Analyze goes further by adding performance analysis, fully executing the SQL and displaying the time and resources consumed during the execution of the query. It provides detailed information for IoTDB users to deeply understand query details and perform query optimization.
+### Explain
+The Explain command allows users to view the execution plan of an SQL query. The execution plan is presented in the form of operators, describing how IoTDB will execute the query. The output of Explain includes information such as data access strategies, whether filter conditions are pushed down, and the distribution of the query plan across different nodes, providing users with a means to visualize the internal logic of the query execution. Its syntax is as follows:
+
+```sql
+EXPLAIN <SELECT_STATEMENT>
+```
+Where SELECT_STATEMENT is the SQL statement related to the query. An example of usage is as follows:
+```sql
+insert into root.explain.data(timestamp, column1, column2) values(1710494762, "hello", "explain")
+
+explain select * from root.explain.data
+```
+Execute the SQL and get the following result:
+```
++-----------------------------------------------------------------------+
+| distribution plan|
++-----------------------------------------------------------------------+
+| ┌───────────────────┐ |
+| │FullOuterTimeJoin-3│ |
+| │Order: ASC │ |
+| └───────────────────┘ |
+| ┌─────────────────┴─────────────────┐ |
+| │ │ |
+|┌─────────────────────────────────┐ ┌─────────────────────────────────┐|
+|│SeriesScan-4 │ │SeriesScan-5 │|
+|│Series: root.explain.data.column1│ │Series: root.explain.data.column2│|
+|│Partition: 3 │ │Partition: 3 │|
+|└─────────────────────────────────┘ └─────────────────────────────────┘|
++-----------------------------------------------------------------------+
+```
+It can be seen that IoTDB retrieves the data for column1 and column2 through two separate SeriesScan nodes, and finally connects them using fullOuterTimeJoin.
+### Explain Analyze
+Explain Analyze is a performance analysis SQL built into the IoTDB query engine. Unlike Explain, it executes the corresponding query plan and collects execution information. It can be used to track the specific performance distribution of a query, observe resources, and conduct performance tuning and anomaly analysis.
+
+Compared to other analysis methods where can be attached in IoTDB, Explain Analyze does not require deployment effort and can analyze individual SQL statements, allowing for more precise problem identification:
+
+|Method|Installation Difficulty|Impact on Business|Supports Distributed System|Analysis of Individual SQL|
+|:----|:----|:----|:----|:----|
+|Arthas Sampling|Requires downloading and running files on the machine: some internal networks cannot directly install Arthas; and sometimes, it requires restarting the application after installation|CPU sampling may affect the response speed of online business|No|Online businesses usually have various query loads, and the overall monitoring metrics and sampling results can only reflect the overall load and response times of all queries, unable to analyze the response time of individual [...]
+|Monitor Tool|Requires enabling monitoring services or deploying Grafana, and open-source users do not have a monitoring dashboard|Recording metrics will bring additional response time|Yes| Same as Arthas|
+|Explain Analyze|No installation required, available upon starting IoTDB|Only affects the single query being analyzed, with no impact on other online loads|Yes|Allows for tracking and analysis of individual SQL statements|
+
+Its syntax is as following:
+```sql
+EXPLAIN ANALYZE [VERBOSE] <SELECT_STATEMENT>
+```
+In it, SELECT_STATEMENT corresponds to the query statement to be analyzed. By default, in order to simplify the results as much as possible, EXPLAIN ANALYZE will omit some information. Specifying VERBOSE can be used to output this information.
+
+The result set of EXPLAIN ANALYZE will include the following information:
+
+
+
+QueryStatistics contains the statistical information at the query level, primarily including the time consumed during the plan parsing phase, Fragment metadata, and other information.
+
+FragmentInstance is IoTDB's encapsulation of a query plan on a node. Each node will output a Fragment information in the result set, mainly including FragmentStatistics and operator information.
+
+FragmentStatistics includes the statistical information of a Fragment, such as the total actual duration (wall-clock time), the TsFiles involved, scheduling information, etc. The information of a Fragment is also displayed in a tree hierarchy of plan nodes within that Fragment, including:
+* CPU runtime
+* Number of output rows
+* Number of times a specific interface is called
+* Memory usage
+* Node-specific custom information
+
+Below is an example of Explain Analyze:
+
+```sql
+insert into root.explain.analyze.data(timestamp, column1, column2, column3) values(1710494762, "hello", "explain", "analyze")
+insert into root.explain.analyze.data(timestamp, column1, column2, column3) values(1710494862, "hello2", "explain2", "analyze2")
+insert into root.explain.analyze.data(timestamp, column1, column2, column3) values(1710494962, "hello3", "explain3", "analyze3")
+explain analyze select column2 from root.explain.analyze.data order by column1
+```
+Get result following:
+```
++-------------------------------------------------------------------------------------------------+
+| Explain Analyze|
++-------------------------------------------------------------------------------------------------+
+|Analyze Cost: 1.739 ms |
+|Fetch Partition Cost: 0.940 ms |
+|Fetch Schema Cost: 0.066 ms |
+|Logical Plan Cost: 0.000 ms |
+|Logical Optimization Cost: 0.000 ms |
+|Distribution Plan Cost: 0.000 ms |
+|Fragment Instances Count: 1 |
+| |
+|FRAGMENT-INSTANCE[Id: 20240315_115800_00030_1.2.0][IP: 127.0.0.1][DataRegion: 4][State: FINISHED]|
+| Total Wall Time: 25 ms |
+| Cost of initDataQuerySource: 0.175 ms |
+| Seq File(unclosed): 0, Seq File(closed): 1 |
+| UnSeq File(unclosed): 0, UnSeq File(closed): 0 |
+| ready queued time: 0.280 ms, blocked queued time: 2.456 ms |
+| [PlanNodeId 10]: IdentitySinkNode(IdentitySinkOperator) |
+| CPU Time: 0.780 ms |
+| output: 1 rows |
+| HasNext() Called Count: 3 |
+| Next() Called Count: 2 |
+| Estimated Memory Size: : 1245184 |
+| [PlanNodeId 5]: TransformNode(TransformOperator) |
+| CPU Time: 0.764 ms |
+| output: 1 rows |
+| HasNext() Called Count: 3 |
+| Next() Called Count: 2 |
+| Estimated Memory Size: : 1245184 |
+| [PlanNodeId 4]: SortNode(SortOperator) |
+| CPU Time: 0.721 ms |
+| output: 1 rows |
+| HasNext() Called Count: 3 |
+| Next() Called Count: 2 |
+| sortCost/ns: 1125 |
+| sortedDataSize: 272 |
+| prepareCost/ns: 610834 |
+| [PlanNodeId 3]: FullOuterTimeJoinNode(FullOuterTimeJoinOperator) |
+| CPU Time: 0.706 ms |
+| output: 1 rows |
+| HasNext() Called Count: 5 |
+| Next() Called Count: 1 |
+| [PlanNodeId 7]: SeriesScanNode(SeriesScanOperator) |
+| CPU Time: 1.085 ms |
+| output: 1 rows |
+| HasNext() Called Count: 2 |
+| Next() Called Count: 1 |
+| SeriesPath: root.explain.analyze.data.column2 |
+| [PlanNodeId 8]: SeriesScanNode(SeriesScanOperator) |
+| CPU Time: 1.091 ms |
+| output: 1 rows |
+| HasNext() Called Count: 2 |
+| Next() Called Count: 1 |
+| SeriesPath: root.explain.analyze.data.column1 |
++-------------------------------------------------------------------------------------------------+
+```
+#### PlanNode Compaction in the Result Of EXPLAIN ANALYZE
+
+
+
+
+In a Fragment, the information of all nodes executed in the current node will be output. However, when a query involves too many series, outputting each seriesScanNode can lead to an excessively large result set from Explain Analyze. Therefore, when the same type of nodes exceeds 10, all nodes of the same type under the current Fragment will be merged. The statistical information is also accumulated after the merge, and some customized information that cannot be merged will be directly d [...]
+
+The threshold for triggering the merge of nodes can be set by modifying the configuration item `merge_threshold_of_explain_analyze` in iotdb-common.properties, and this parameter supports hot loading. Below is a part of the result example after triggering a merge:
+
+```
+Analyze Cost: 143.679 ms
+Fetch Partition Cost: 22.023 ms
+Fetch Schema Cost: 63.086 ms
+Logical Plan Cost: 0.000 ms
+Logical Optimization Cost: 0.000 ms
+Distribution Plan Cost: 0.000 ms
+Fragment Instances Count: 2
+
+FRAGMENT-INSTANCE[Id: 20240311_041502_00001_1.2.0][IP: 192.168.130.9][DataRegion: 14]
+ Total Wall Time: 39964 ms
+ Cost of initDataQuerySource: 1.834 ms
+ Seq File(unclosed): 0, Seq File(closed): 3
+ UnSeq File(unclosed): 0, UnSeq File(closed): 0
+ ready queued time: 504.334 ms, blocked queued time: 25356.419 ms
+ [PlanNodeId 20793]: IdentitySinkNode(IdentitySinkOperator) Count: * 1
+ CPU Time: 24440.724 ms
+ input: 71216 rows
+ HasNext() Called Count: 35963
+ Next() Called Count: 35962
+ Estimated Memory Size: : 33882112
+ [PlanNodeId 10385]: FullOuterTimeJoinNode(FullOuterTimeJoinOperator) Count: * 8
+ CPU Time: 41437.708 ms
+ input: 243011 rows
+ HasNext() Called Count: 41965
+ Next() Called Count: 41958
+ Estimated Memory Size: : 33882112
+ [PlanNodeId 11569]: SeriesScanNode(SeriesScanOperator) Count: * 1340
+ CPU Time: 1397.822 ms
+ input: 134000 rows
+ HasNext() Called Count: 2353
+ Next() Called Count: 1340
+ Estimated Memory Size: : 32833536
+ [PlanNodeId 20778]: ExchangeNode(ExchangeOperator) Count: * 7
+ CPU Time: 109.245 ms
+ input: 71891 rows
+ HasNext() Called Count: 1431
+ Next() Called Count: 1431
+
+FRAGMENT-INSTANCE[Id: 20240311_041502_00001_1.3.0][IP: 192.168.130.9][DataRegion: 11]
+ Total Wall Time: 39912 ms
+ Cost of initDataQuerySource: 15.439 ms
+ Seq File(unclosed): 0, Seq File(closed): 2
+ UnSeq File(unclosed): 0, UnSeq File(closed): 0
+ ready queued time: 152.988 ms, blocked queued time: 37775.356 ms
+ [PlanNodeId 20786]: IdentitySinkNode(IdentitySinkOperator) Count: * 1
+ CPU Time: 2020.258 ms
+ input: 48800 rows
+ HasNext() Called Count: 978
+ Next() Called Count: 978
+ Estimated Memory Size: : 42336256
+ [PlanNodeId 20771]: FullOuterTimeJoinNode(FullOuterTimeJoinOperator) Count: * 8
+ CPU Time: 5255.307 ms
+ input: 195800 rows
+ HasNext() Called Count: 2455
+ Next() Called Count: 2448
+ Estimated Memory Size: : 42336256
+ [PlanNodeId 11867]: SeriesScanNode(SeriesScanOperator) Count: * 1680
+ CPU Time: 1248.080 ms
+ input: 168000 rows
+ HasNext() Called Count: 3198
+ Next() Called Count: 1680
+ Estimated Memory Size: : 41287680
+
+......
+```
+
+
+#### Query Timeout Handling
+Explain Analyze is a unique type of query. When it times out, we are unable to obtain the analysis results from the return. To address this, allowing for the investigation of timeout reasons through analysis results even in cases of timeout, Explain Analyze offers a timed logging mechanism. After certain intervals, the current results of Explain Analyze are output in text form to a dedicated log file. This way, when a query times out, one can go to the logs to investigate the correspondi [...]
+
+The logging interval is calculated based on the query's timeout setting, ensuring that there are at least two records of results in case of a timeout.
\ No newline at end of file
diff --git a/src/zh/UserGuide/Master/SQL-Manual/SQL-Manual.md b/src/zh/UserGuide/Master/SQL-Manual/SQL-Manual.md
index 4c0fbfd..84c9ee5 100644
--- a/src/zh/UserGuide/Master/SQL-Manual/SQL-Manual.md
+++ b/src/zh/UserGuide/Master/SQL-Manual/SQL-Manual.md
@@ -1023,7 +1023,15 @@ select * into ::(backup_${4}) from root.sg.** align by device;
select s1, s2 into root.sg_copy.d1(t1, t2), aligned root.sg_copy.d2(t1, t2) from root.sg.d1, root.sg.d2 align by device;
```
-
+## 运维语句
+生成对应的查询计划
+```
+explain select s1,s2 from root.sg.d1
+```
+执行对应的查询语句,并获取分析结果
+```
+explain analyze select s1,s2 from root.sg.d1 order by s1
+```
## 运算符
diff --git a/src/zh/UserGuide/Master/User-Manual/Maintennance.md b/src/zh/UserGuide/Master/User-Manual/Maintennance.md
new file mode 100644
index 0000000..cd5aa18
--- /dev/null
+++ b/src/zh/UserGuide/Master/User-Manual/Maintennance.md
@@ -0,0 +1,236 @@
+<!--
+
+ Licensed to the Apache Software Foundation (ASF) under one
+ or more contributor license agreements. See the NOTICE file
+ distributed with this work for additional information
+ regarding copyright ownership. The ASF licenses this file
+ to you under the Apache License, Version 2.0 (the
+ "License"); you may not use this file except in compliance
+ with the License. You may obtain a copy of the License at
+
+ http://www.apache.org/licenses/LICENSE-2.0
+
+ Unless required by applicable law or agreed to in writing,
+ software distributed under the License is distributed on an
+ "AS IS" BASIS, WITHOUT WARRANTIES OR CONDITIONS OF ANY
+ KIND, either express or implied. See the License for the
+ specific language governing permissions and limitations
+ under the License.
+
+-->
+
+# 运维语句
+## 概述
+
+查询分析的意义在于帮助用户理解查询的执行机制和性能瓶颈,从而实现查询优化和性能提升。这不仅关乎到查询的执行效率,也直接影响到应用的用户体验和资源的有效利用。为了进行有效的查询分析,IoTDB提供了查询分析工具:Explain和Explain Analyze。
+
+Explain工具允许用户预览查询SQL的执行计划,包括IoTDB如何组织数据检索和处理。
+
+Explain Analyze则在此基础上增加了性能分析,完整执行SQL并展示查询执行过程中的时间和资源消耗。为IoTDB用户深入理解查询详情以及进行查询优化提供了详细的相关信息。
+### Explain
+Explain命令允许用户查看SQL查询的执行计划。执行计划以算子的形式展示,描述了IoTDB会如何执行查询。Explain的输出包括了数据访问策略、过滤条件是否下推以及查询计划在不同节点的分配等信息,为用户提供了一种手段,以可视化查询的内部执行逻辑。其语法如下:
+```sql
+EXPLAIN <SELECT_STATEMENT>
+```
+其中SELECT_STATEMENT是查询相关的SQL语句。一个使用案例如下:
+```sql
+insert into root.explain.data(timestamp, column1, column2) values(1710494762, "hello", "explain")
+
+explain select * from root.explain.data
+```
+执行上方SQL,会得到如下结果:
+```
++-----------------------------------------------------------------------+
+| distribution plan|
++-----------------------------------------------------------------------+
+| ┌───────────────────┐ |
+| │FullOuterTimeJoin-3│ |
+| │Order: ASC │ |
+| └───────────────────┘ |
+| ┌─────────────────┴─────────────────┐ |
+| │ │ |
+|┌─────────────────────────────────┐ ┌─────────────────────────────────┐|
+|│SeriesScan-4 │ │SeriesScan-5 │|
+|│Series: root.explain.data.column1│ │Series: root.explain.data.column2│|
+|│Partition: 3 │ │Partition: 3 │|
+|└─────────────────────────────────┘ └─────────────────────────────────┘|
++-----------------------------------------------------------------------+
+```
+不难看出,IoTDB分别通过两个SeriesScan节点去获取column1和column2的数据,最后通过fullOuterTimeJoin将其连接。
+### Explain Analyze
+Explain Analyze是IOTDB查询引擎自带的性能分析SQL,与Explain不同,它会执行对应的查询计划并统计执行信息,可以用于追踪一条查询的具体性能分布,用于对资源进行观察,进行性能调优与异常分析。
+
+与IoTDB常用的排查手段相比,Explain Analyze没有部署负担,同时能够针对单条sql进行分析,能够更好定位问题:
+
+|方法|安装难度|对业务的影响|支持分布式|单条sql分析|
+|:----|:----|:----|:----|:----|
+|Arthas抽样|需要在机器上下载并运行文件:部分内网无法直接安装Arthas ;且安装后,有时需要重启应用|CPU 抽样可能会影响线上业务的响应速度|否|线上业务通常都有多种查询负载,整体的监控指标以及抽样结果,只能反映所有查询的整体负载和耗时情况,无法对单条慢sql做耗时分析|
+|监控面板|需要开启监控服务并部署grafana,且开源用户没有监控面板|记录指标会带来额外耗时|是| 与Arthas相同|
+|Explain Analyze|无需安装,启动IoTDB即可|只会影响当前分析的单条查询,对线上其他负载无影响|是|可以对单条sql进行追踪分析|
+
+其语法如下:
+```sql
+EXPLAIN ANALYZE [VERBOSE] <SELECT_STATEMENT>
+```
+其中SELECT_STATEMENT对应需要分析的查询语句;默认情况下,为了尽可能简化结果,EXPLAIN ANALYZE会省略部分信息,指定VERBOSE可以用来输出这些信息。
+
+在EXPLAIN ANALYZE的结果集中,会包含如下信息
+
+
+
+其中,QueryStatistics包含查询层面进的统计信息,主要包含规划解析阶段耗时,Fragment元数据等信息。
+
+FragmentInstance是IoTDB在一个节点上查询计划的封装,每一个节点都会在结果集中输出一份Fragment信息,主要包含FragmentStatistics和算子信息。
+
+其中,FragmentStastistics包含Fragment的统计信息,包括总实际耗时(墙上时间),所涉及到的TsFile,调度信息等情况。在一个Fragment的信息输出同时会以节点树层级的方式展示该Fragment下计划节点的统计信息,主要包括:
+* CPU运行时间
+* 输出的数据行数
+* 指定接口被调用的次数
+* 所占用的内存
+* 节点专属的定制信息
+
+下面是Explain Analyze的一个样例:
+```sql
+insert into root.explain.analyze.data(timestamp, column1, column2, column3) values(1710494762, "hello", "explain", "analyze")
+insert into root.explain.analyze.data(timestamp, column1, column2, column3) values(1710494862, "hello2", "explain2", "analyze2")
+insert into root.explain.analyze.data(timestamp, column1, column2, column3) values(1710494962, "hello3", "explain3", "analyze3")
+explain analyze select column2 from root.explain.analyze.data order by column1
+```
+得到输出如下:
+```
++-------------------------------------------------------------------------------------------------+
+| Explain Analyze|
++-------------------------------------------------------------------------------------------------+
+|Analyze Cost: 1.739 ms |
+|Fetch Partition Cost: 0.940 ms |
+|Fetch Schema Cost: 0.066 ms |
+|Logical Plan Cost: 0.000 ms |
+|Logical Optimization Cost: 0.000 ms |
+|Distribution Plan Cost: 0.000 ms |
+|Fragment Instances Count: 1 |
+| |
+|FRAGMENT-INSTANCE[Id: 20240315_115800_00030_1.2.0][IP: 127.0.0.1][DataRegion: 4][State: FINISHED]|
+| Total Wall Time: 25 ms |
+| Cost of initDataQuerySource: 0.175 ms |
+| Seq File(unclosed): 0, Seq File(closed): 1 |
+| UnSeq File(unclosed): 0, UnSeq File(closed): 0 |
+| ready queued time: 0.280 ms, blocked queued time: 2.456 ms |
+| [PlanNodeId 10]: IdentitySinkNode(IdentitySinkOperator) |
+| CPU Time: 0.780 ms |
+| output: 1 rows |
+| HasNext() Called Count: 3 |
+| Next() Called Count: 2 |
+| Estimated Memory Size: : 1245184 |
+| [PlanNodeId 5]: TransformNode(TransformOperator) |
+| CPU Time: 0.764 ms |
+| output: 1 rows |
+| HasNext() Called Count: 3 |
+| Next() Called Count: 2 |
+| Estimated Memory Size: : 1245184 |
+| [PlanNodeId 4]: SortNode(SortOperator) |
+| CPU Time: 0.721 ms |
+| output: 1 rows |
+| HasNext() Called Count: 3 |
+| Next() Called Count: 2 |
+| sortCost/ns: 1125 |
+| sortedDataSize: 272 |
+| prepareCost/ns: 610834 |
+| [PlanNodeId 3]: FullOuterTimeJoinNode(FullOuterTimeJoinOperator) |
+| CPU Time: 0.706 ms |
+| output: 1 rows |
+| HasNext() Called Count: 5 |
+| Next() Called Count: 1 |
+| [PlanNodeId 7]: SeriesScanNode(SeriesScanOperator) |
+| CPU Time: 1.085 ms |
+| output: 1 rows |
+| HasNext() Called Count: 2 |
+| Next() Called Count: 1 |
+| SeriesPath: root.explain.analyze.data.column2 |
+| [PlanNodeId 8]: SeriesScanNode(SeriesScanOperator) |
+| CPU Time: 1.091 ms |
+| output: 1 rows |
+| HasNext() Called Count: 2 |
+| Next() Called Count: 1 |
+| SeriesPath: root.explain.analyze.data.column1 |
++-------------------------------------------------------------------------------------------------+
+```
+#### EXPLAIN ANALYZE分析结果中的算子压缩
+
+
+
+在Fragment中会输出当前节点中执行的所有节点信息,然而当一次查询涉及的序列过多时,每个节点都被输出会导致Explain Analyze返回的结果集过大,因此当相同类型的节点超过10个时,会合并当前Fragment下所有相同类型的节点。合并后统计信息也被累积,对于一些无法合并的定制信息会直接丢弃。
+
+可以通过修改iotdb-common.properties中的配置项`merge_threshold_of_explain_analyze`来设置触发合并的节点阈值,该参数支持热加载。下面是一个触发合并后的部分结果示例:
+
+```
+Analyze Cost: 143.679 ms
+Fetch Partition Cost: 22.023 ms
+Fetch Schema Cost: 63.086 ms
+Logical Plan Cost: 0.000 ms
+Logical Optimization Cost: 0.000 ms
+Distribution Plan Cost: 0.000 ms
+Fragment Instances Count: 2
+
+FRAGMENT-INSTANCE[Id: 20240311_041502_00001_1.2.0][IP: 192.168.130.9][DataRegion: 14]
+ Total Wall Time: 39964 ms
+ Cost of initDataQuerySource: 1.834 ms
+ Seq File(unclosed): 0, Seq File(closed): 3
+ UnSeq File(unclosed): 0, UnSeq File(closed): 0
+ ready queued time: 504.334 ms, blocked queued time: 25356.419 ms
+ [PlanNodeId 20793]: IdentitySinkNode(IdentitySinkOperator) Count: * 1
+ CPU Time: 24440.724 ms
+ input: 71216 rows
+ HasNext() Called Count: 35963
+ Next() Called Count: 35962
+ Estimated Memory Size: : 33882112
+ [PlanNodeId 10385]: FullOuterTimeJoinNode(FullOuterTimeJoinOperator) Count: * 8
+ CPU Time: 41437.708 ms
+ input: 243011 rows
+ HasNext() Called Count: 41965
+ Next() Called Count: 41958
+ Estimated Memory Size: : 33882112
+ [PlanNodeId 11569]: SeriesScanNode(SeriesScanOperator) Count: * 1340
+ CPU Time: 1397.822 ms
+ input: 134000 rows
+ HasNext() Called Count: 2353
+ Next() Called Count: 1340
+ Estimated Memory Size: : 32833536
+ [PlanNodeId 20778]: ExchangeNode(ExchangeOperator) Count: * 7
+ CPU Time: 109.245 ms
+ input: 71891 rows
+ HasNext() Called Count: 1431
+ Next() Called Count: 1431
+
+FRAGMENT-INSTANCE[Id: 20240311_041502_00001_1.3.0][IP: 192.168.130.9][DataRegion: 11]
+ Total Wall Time: 39912 ms
+ Cost of initDataQuerySource: 15.439 ms
+ Seq File(unclosed): 0, Seq File(closed): 2
+ UnSeq File(unclosed): 0, UnSeq File(closed): 0
+ ready queued time: 152.988 ms, blocked queued time: 37775.356 ms
+ [PlanNodeId 20786]: IdentitySinkNode(IdentitySinkOperator) Count: * 1
+ CPU Time: 2020.258 ms
+ input: 48800 rows
+ HasNext() Called Count: 978
+ Next() Called Count: 978
+ Estimated Memory Size: : 42336256
+ [PlanNodeId 20771]: FullOuterTimeJoinNode(FullOuterTimeJoinOperator) Count: * 8
+ CPU Time: 5255.307 ms
+ input: 195800 rows
+ HasNext() Called Count: 2455
+ Next() Called Count: 2448
+ Estimated Memory Size: : 42336256
+ [PlanNodeId 11867]: SeriesScanNode(SeriesScanOperator) Count: * 1680
+ CPU Time: 1248.080 ms
+ input: 168000 rows
+ HasNext() Called Count: 3198
+ Next() Called Count: 1680
+ Estimated Memory Size: : 41287680
+
+......
+```
+
+#### 查询超时处理
+
+Explain Analyze本身是一种特殊的查询,当执行超时的时候,我们是无法从返回结果中获得分析结果的。为了处理该情况,使得在超时的情况下也可以通过分析结果排查超时原因,Explain Analyze提供了**定时日志**机制,每经过一定的时间间隔会将Explain Analyze的当前结果以文本的形式输出到专门的日志中。这样当查询超时时,就可以前往logs中查看对应的日志进行排查。
+
+日志的时间间隔基于查询的超时时间进行计算,可以保证在超时的情况下至少会有两次的结果记录。
\ No newline at end of file
diff --git a/src/zh/UserGuide/latest/SQL-Manual/SQL-Manual.md b/src/zh/UserGuide/latest/SQL-Manual/SQL-Manual.md
index 6d2848a..640b666 100644
--- a/src/zh/UserGuide/latest/SQL-Manual/SQL-Manual.md
+++ b/src/zh/UserGuide/latest/SQL-Manual/SQL-Manual.md
@@ -1023,8 +1023,15 @@ select * into ::(backup_${4}) from root.sg.** align by device;
select s1, s2 into root.sg_copy.d1(t1, t2), aligned root.sg_copy.d2(t1, t2) from root.sg.d1, root.sg.d2 align by device;
```
-
-
+## 运维语句
+生成对应的查询计划
+```
+explain select s1,s2 from root.sg.d1
+```
+执行对应的查询语句,并获取分析结果
+```
+explain analyze select s1,s2 from root.sg.d1 order by s1
+```
## 运算符
更多见文档[Operator-and-Expression](../Reference/Function-and-Expression.md#算数运算符和函数)
diff --git a/src/zh/UserGuide/latest/User-Manual/Maintennance.md b/src/zh/UserGuide/latest/User-Manual/Maintennance.md
new file mode 100644
index 0000000..cd5aa18
--- /dev/null
+++ b/src/zh/UserGuide/latest/User-Manual/Maintennance.md
@@ -0,0 +1,236 @@
+<!--
+
+ Licensed to the Apache Software Foundation (ASF) under one
+ or more contributor license agreements. See the NOTICE file
+ distributed with this work for additional information
+ regarding copyright ownership. The ASF licenses this file
+ to you under the Apache License, Version 2.0 (the
+ "License"); you may not use this file except in compliance
+ with the License. You may obtain a copy of the License at
+
+ http://www.apache.org/licenses/LICENSE-2.0
+
+ Unless required by applicable law or agreed to in writing,
+ software distributed under the License is distributed on an
+ "AS IS" BASIS, WITHOUT WARRANTIES OR CONDITIONS OF ANY
+ KIND, either express or implied. See the License for the
+ specific language governing permissions and limitations
+ under the License.
+
+-->
+
+# 运维语句
+## 概述
+
+查询分析的意义在于帮助用户理解查询的执行机制和性能瓶颈,从而实现查询优化和性能提升。这不仅关乎到查询的执行效率,也直接影响到应用的用户体验和资源的有效利用。为了进行有效的查询分析,IoTDB提供了查询分析工具:Explain和Explain Analyze。
+
+Explain工具允许用户预览查询SQL的执行计划,包括IoTDB如何组织数据检索和处理。
+
+Explain Analyze则在此基础上增加了性能分析,完整执行SQL并展示查询执行过程中的时间和资源消耗。为IoTDB用户深入理解查询详情以及进行查询优化提供了详细的相关信息。
+### Explain
+Explain命令允许用户查看SQL查询的执行计划。执行计划以算子的形式展示,描述了IoTDB会如何执行查询。Explain的输出包括了数据访问策略、过滤条件是否下推以及查询计划在不同节点的分配等信息,为用户提供了一种手段,以可视化查询的内部执行逻辑。其语法如下:
+```sql
+EXPLAIN <SELECT_STATEMENT>
+```
+其中SELECT_STATEMENT是查询相关的SQL语句。一个使用案例如下:
+```sql
+insert into root.explain.data(timestamp, column1, column2) values(1710494762, "hello", "explain")
+
+explain select * from root.explain.data
+```
+执行上方SQL,会得到如下结果:
+```
++-----------------------------------------------------------------------+
+| distribution plan|
++-----------------------------------------------------------------------+
+| ┌───────────────────┐ |
+| │FullOuterTimeJoin-3│ |
+| │Order: ASC │ |
+| └───────────────────┘ |
+| ┌─────────────────┴─────────────────┐ |
+| │ │ |
+|┌─────────────────────────────────┐ ┌─────────────────────────────────┐|
+|│SeriesScan-4 │ │SeriesScan-5 │|
+|│Series: root.explain.data.column1│ │Series: root.explain.data.column2│|
+|│Partition: 3 │ │Partition: 3 │|
+|└─────────────────────────────────┘ └─────────────────────────────────┘|
++-----------------------------------------------------------------------+
+```
+不难看出,IoTDB分别通过两个SeriesScan节点去获取column1和column2的数据,最后通过fullOuterTimeJoin将其连接。
+### Explain Analyze
+Explain Analyze是IOTDB查询引擎自带的性能分析SQL,与Explain不同,它会执行对应的查询计划并统计执行信息,可以用于追踪一条查询的具体性能分布,用于对资源进行观察,进行性能调优与异常分析。
+
+与IoTDB常用的排查手段相比,Explain Analyze没有部署负担,同时能够针对单条sql进行分析,能够更好定位问题:
+
+|方法|安装难度|对业务的影响|支持分布式|单条sql分析|
+|:----|:----|:----|:----|:----|
+|Arthas抽样|需要在机器上下载并运行文件:部分内网无法直接安装Arthas ;且安装后,有时需要重启应用|CPU 抽样可能会影响线上业务的响应速度|否|线上业务通常都有多种查询负载,整体的监控指标以及抽样结果,只能反映所有查询的整体负载和耗时情况,无法对单条慢sql做耗时分析|
+|监控面板|需要开启监控服务并部署grafana,且开源用户没有监控面板|记录指标会带来额外耗时|是| 与Arthas相同|
+|Explain Analyze|无需安装,启动IoTDB即可|只会影响当前分析的单条查询,对线上其他负载无影响|是|可以对单条sql进行追踪分析|
+
+其语法如下:
+```sql
+EXPLAIN ANALYZE [VERBOSE] <SELECT_STATEMENT>
+```
+其中SELECT_STATEMENT对应需要分析的查询语句;默认情况下,为了尽可能简化结果,EXPLAIN ANALYZE会省略部分信息,指定VERBOSE可以用来输出这些信息。
+
+在EXPLAIN ANALYZE的结果集中,会包含如下信息
+
+
+
+其中,QueryStatistics包含查询层面进的统计信息,主要包含规划解析阶段耗时,Fragment元数据等信息。
+
+FragmentInstance是IoTDB在一个节点上查询计划的封装,每一个节点都会在结果集中输出一份Fragment信息,主要包含FragmentStatistics和算子信息。
+
+其中,FragmentStastistics包含Fragment的统计信息,包括总实际耗时(墙上时间),所涉及到的TsFile,调度信息等情况。在一个Fragment的信息输出同时会以节点树层级的方式展示该Fragment下计划节点的统计信息,主要包括:
+* CPU运行时间
+* 输出的数据行数
+* 指定接口被调用的次数
+* 所占用的内存
+* 节点专属的定制信息
+
+下面是Explain Analyze的一个样例:
+```sql
+insert into root.explain.analyze.data(timestamp, column1, column2, column3) values(1710494762, "hello", "explain", "analyze")
+insert into root.explain.analyze.data(timestamp, column1, column2, column3) values(1710494862, "hello2", "explain2", "analyze2")
+insert into root.explain.analyze.data(timestamp, column1, column2, column3) values(1710494962, "hello3", "explain3", "analyze3")
+explain analyze select column2 from root.explain.analyze.data order by column1
+```
+得到输出如下:
+```
++-------------------------------------------------------------------------------------------------+
+| Explain Analyze|
++-------------------------------------------------------------------------------------------------+
+|Analyze Cost: 1.739 ms |
+|Fetch Partition Cost: 0.940 ms |
+|Fetch Schema Cost: 0.066 ms |
+|Logical Plan Cost: 0.000 ms |
+|Logical Optimization Cost: 0.000 ms |
+|Distribution Plan Cost: 0.000 ms |
+|Fragment Instances Count: 1 |
+| |
+|FRAGMENT-INSTANCE[Id: 20240315_115800_00030_1.2.0][IP: 127.0.0.1][DataRegion: 4][State: FINISHED]|
+| Total Wall Time: 25 ms |
+| Cost of initDataQuerySource: 0.175 ms |
+| Seq File(unclosed): 0, Seq File(closed): 1 |
+| UnSeq File(unclosed): 0, UnSeq File(closed): 0 |
+| ready queued time: 0.280 ms, blocked queued time: 2.456 ms |
+| [PlanNodeId 10]: IdentitySinkNode(IdentitySinkOperator) |
+| CPU Time: 0.780 ms |
+| output: 1 rows |
+| HasNext() Called Count: 3 |
+| Next() Called Count: 2 |
+| Estimated Memory Size: : 1245184 |
+| [PlanNodeId 5]: TransformNode(TransformOperator) |
+| CPU Time: 0.764 ms |
+| output: 1 rows |
+| HasNext() Called Count: 3 |
+| Next() Called Count: 2 |
+| Estimated Memory Size: : 1245184 |
+| [PlanNodeId 4]: SortNode(SortOperator) |
+| CPU Time: 0.721 ms |
+| output: 1 rows |
+| HasNext() Called Count: 3 |
+| Next() Called Count: 2 |
+| sortCost/ns: 1125 |
+| sortedDataSize: 272 |
+| prepareCost/ns: 610834 |
+| [PlanNodeId 3]: FullOuterTimeJoinNode(FullOuterTimeJoinOperator) |
+| CPU Time: 0.706 ms |
+| output: 1 rows |
+| HasNext() Called Count: 5 |
+| Next() Called Count: 1 |
+| [PlanNodeId 7]: SeriesScanNode(SeriesScanOperator) |
+| CPU Time: 1.085 ms |
+| output: 1 rows |
+| HasNext() Called Count: 2 |
+| Next() Called Count: 1 |
+| SeriesPath: root.explain.analyze.data.column2 |
+| [PlanNodeId 8]: SeriesScanNode(SeriesScanOperator) |
+| CPU Time: 1.091 ms |
+| output: 1 rows |
+| HasNext() Called Count: 2 |
+| Next() Called Count: 1 |
+| SeriesPath: root.explain.analyze.data.column1 |
++-------------------------------------------------------------------------------------------------+
+```
+#### EXPLAIN ANALYZE分析结果中的算子压缩
+
+
+
+在Fragment中会输出当前节点中执行的所有节点信息,然而当一次查询涉及的序列过多时,每个节点都被输出会导致Explain Analyze返回的结果集过大,因此当相同类型的节点超过10个时,会合并当前Fragment下所有相同类型的节点。合并后统计信息也被累积,对于一些无法合并的定制信息会直接丢弃。
+
+可以通过修改iotdb-common.properties中的配置项`merge_threshold_of_explain_analyze`来设置触发合并的节点阈值,该参数支持热加载。下面是一个触发合并后的部分结果示例:
+
+```
+Analyze Cost: 143.679 ms
+Fetch Partition Cost: 22.023 ms
+Fetch Schema Cost: 63.086 ms
+Logical Plan Cost: 0.000 ms
+Logical Optimization Cost: 0.000 ms
+Distribution Plan Cost: 0.000 ms
+Fragment Instances Count: 2
+
+FRAGMENT-INSTANCE[Id: 20240311_041502_00001_1.2.0][IP: 192.168.130.9][DataRegion: 14]
+ Total Wall Time: 39964 ms
+ Cost of initDataQuerySource: 1.834 ms
+ Seq File(unclosed): 0, Seq File(closed): 3
+ UnSeq File(unclosed): 0, UnSeq File(closed): 0
+ ready queued time: 504.334 ms, blocked queued time: 25356.419 ms
+ [PlanNodeId 20793]: IdentitySinkNode(IdentitySinkOperator) Count: * 1
+ CPU Time: 24440.724 ms
+ input: 71216 rows
+ HasNext() Called Count: 35963
+ Next() Called Count: 35962
+ Estimated Memory Size: : 33882112
+ [PlanNodeId 10385]: FullOuterTimeJoinNode(FullOuterTimeJoinOperator) Count: * 8
+ CPU Time: 41437.708 ms
+ input: 243011 rows
+ HasNext() Called Count: 41965
+ Next() Called Count: 41958
+ Estimated Memory Size: : 33882112
+ [PlanNodeId 11569]: SeriesScanNode(SeriesScanOperator) Count: * 1340
+ CPU Time: 1397.822 ms
+ input: 134000 rows
+ HasNext() Called Count: 2353
+ Next() Called Count: 1340
+ Estimated Memory Size: : 32833536
+ [PlanNodeId 20778]: ExchangeNode(ExchangeOperator) Count: * 7
+ CPU Time: 109.245 ms
+ input: 71891 rows
+ HasNext() Called Count: 1431
+ Next() Called Count: 1431
+
+FRAGMENT-INSTANCE[Id: 20240311_041502_00001_1.3.0][IP: 192.168.130.9][DataRegion: 11]
+ Total Wall Time: 39912 ms
+ Cost of initDataQuerySource: 15.439 ms
+ Seq File(unclosed): 0, Seq File(closed): 2
+ UnSeq File(unclosed): 0, UnSeq File(closed): 0
+ ready queued time: 152.988 ms, blocked queued time: 37775.356 ms
+ [PlanNodeId 20786]: IdentitySinkNode(IdentitySinkOperator) Count: * 1
+ CPU Time: 2020.258 ms
+ input: 48800 rows
+ HasNext() Called Count: 978
+ Next() Called Count: 978
+ Estimated Memory Size: : 42336256
+ [PlanNodeId 20771]: FullOuterTimeJoinNode(FullOuterTimeJoinOperator) Count: * 8
+ CPU Time: 5255.307 ms
+ input: 195800 rows
+ HasNext() Called Count: 2455
+ Next() Called Count: 2448
+ Estimated Memory Size: : 42336256
+ [PlanNodeId 11867]: SeriesScanNode(SeriesScanOperator) Count: * 1680
+ CPU Time: 1248.080 ms
+ input: 168000 rows
+ HasNext() Called Count: 3198
+ Next() Called Count: 1680
+ Estimated Memory Size: : 41287680
+
+......
+```
+
+#### 查询超时处理
+
+Explain Analyze本身是一种特殊的查询,当执行超时的时候,我们是无法从返回结果中获得分析结果的。为了处理该情况,使得在超时的情况下也可以通过分析结果排查超时原因,Explain Analyze提供了**定时日志**机制,每经过一定的时间间隔会将Explain Analyze的当前结果以文本的形式输出到专门的日志中。这样当查询超时时,就可以前往logs中查看对应的日志进行排查。
+
+日志的时间间隔基于查询的超时时间进行计算,可以保证在超时的情况下至少会有两次的结果记录。
\ No newline at end of file