You are viewing a plain text version of this content. The canonical link for it is here.
Posted to notifications@apisix.apache.org by GitBox <gi...@apache.org> on 2022/08/03 01:55:51 UTC
[GitHub] [apisix] li-zheng-hao opened a new issue, #7603: help request: apisix cannot display grafana
li-zheng-hao opened a new issue, #7603:
URL: https://github.com/apache/apisix/issues/7603
### Description
I ran the apisix demo by referring to the quick start example on the official website :[link](https://apisix.apache.org/zh/docs/apisix/installation-guide/), the comand is:
```sh
git clone https://github.com/apache/apisix-docker.git
cd apisix-docker/example
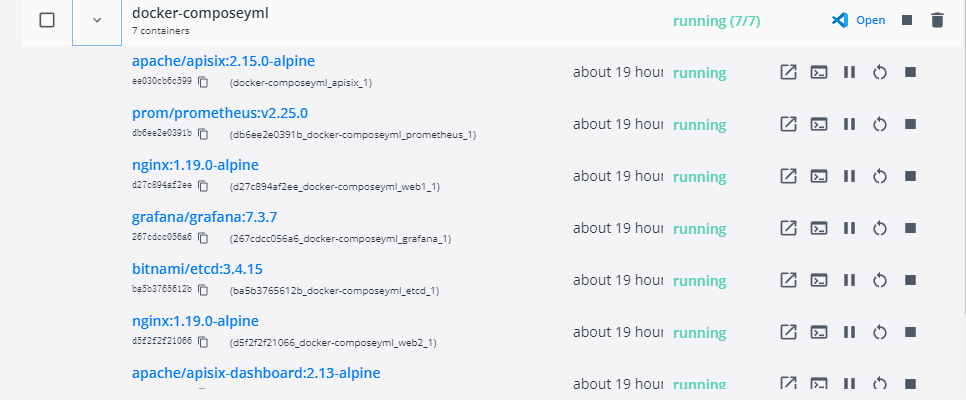
docker-compose -p docker-apisix up -d
```
everything works fine, except that I can't see the grafana monitoring page on the apisix dashboard, error like this :

I looked up some solutions, such as this [link](https://github.com/apache/apisix/discussions/6769), but it didn't solve the problem
### Environment
deploy yaml like this:
```
#
# Licensed to the Apache Software Foundation (ASF) under one or more
# contributor license agreements. See the NOTICE file distributed with
# this work for additional information regarding copyright ownership.
# The ASF licenses this file to You under the Apache License, Version 2.0
# (the "License"); you may not use this file except in compliance with
# the License. You may obtain a copy of the License at
#
# http://www.apache.org/licenses/LICENSE-2.0
#
# Unless required by applicable law or agreed to in writing, software
# distributed under the License is distributed on an "AS IS" BASIS,
# WITHOUT WARRANTIES OR CONDITIONS OF ANY KIND, either express or implied.
# See the License for the specific language governing permissions and
# limitations under the License.
#
version: "3"
services:
apisix-dashboard:
image: apache/apisix-dashboard:2.13-alpine
restart: always
volumes:
- ./dashboard_conf/conf.yaml:/usr/local/apisix-dashboard/conf/conf.yaml
ports:
- "9000:9000"
networks:
apisix:
apisix:
image: apache/apisix:2.15.0-alpine
restart: always
volumes:
- ./apisix_log:/usr/local/apisix/logs
- ./apisix_conf/config.yaml:/usr/local/apisix/conf/config.yaml:ro
depends_on:
- etcd
# network_mode: host
ports:
- "9080:9080/tcp"
- "9091:9091/tcp"
- "9443:9443/tcp"
- "9092:9092/tcp"
networks:
apisix:
etcd:
image: bitnami/etcd:3.4.15
restart: always
volumes:
- etcd_data:/bitnami/etcd
environment:
ETCD_ENABLE_V2: "true"
ALLOW_NONE_AUTHENTICATION: "yes"
ETCD_ADVERTISE_CLIENT_URLS: "http://0.0.0.0:2379"
ETCD_LISTEN_CLIENT_URLS: "http://0.0.0.0:2379"
ports:
- "2379:2379/tcp"
networks:
apisix:
web1:
image: nginx:1.19.0-alpine
restart: always
volumes:
- ./upstream/web1.conf:/etc/nginx/nginx.conf
ports:
- "9081:80/tcp"
environment:
- NGINX_PORT=80
networks:
apisix:
web2:
image: nginx:1.19.0-alpine
restart: always
volumes:
- ./upstream/web2.conf:/etc/nginx/nginx.conf
ports:
- "9082:80/tcp"
environment:
- NGINX_PORT=80
networks:
apisix:
prometheus:
image: prom/prometheus:v2.25.0
restart: always
volumes:
- ./prometheus_conf/prometheus.yml:/etc/prometheus/prometheus.yml
ports:
- "9090:9090"
networks:
apisix:
grafana:
image: grafana/grafana:7.3.7
restart: always
ports:
- "3000:3000"
volumes:
- "./grafana_conf/provisioning:/etc/grafana/provisioning"
- "./grafana_conf/dashboards:/var/lib/grafana/dashboards"
- "./grafana_conf/config/grafana.ini:/etc/grafana/grafana.ini"
networks:
apisix:
networks:
apisix:
driver: bridge
volumes:
etcd_data:
driver: local
```
--
This is an automated message from the Apache Git Service.
To respond to the message, please log on to GitHub and use the
URL above to go to the specific comment.
To unsubscribe, e-mail: notifications-unsubscribe@apisix.apache.org.apache.org
For queries about this service, please contact Infrastructure at:
users@infra.apache.org
[GitHub] [apisix] li-zheng-hao closed issue #7603: help request: apisix cannot display grafana
Posted by GitBox <gi...@apache.org>.
li-zheng-hao closed issue #7603: help request: apisix cannot display grafana
URL: https://github.com/apache/apisix/issues/7603


--
This is an automated message from the Apache Git Service.
To respond to the message, please log on to GitHub and use the
URL above to go to the specific comment.

To unsubscribe, e-mail: notifications-unsubscribe@apisix.apache.org

For queries about this service, please contact Infrastructure at:
users@infra.apache.org
[GitHub] [apisix] lihanghang404 commented on issue #7603: help request: apisix cannot display grafana
Posted by GitBox <gi...@apache.org>.
lihanghang404 commented on issue #7603:
URL: https://github.com/apache/apisix/issues/7603#issuecomment-1335000149
> > @li-zheng-hao 大佬能看下你是怎么加的配置吗?
>
> 上面有
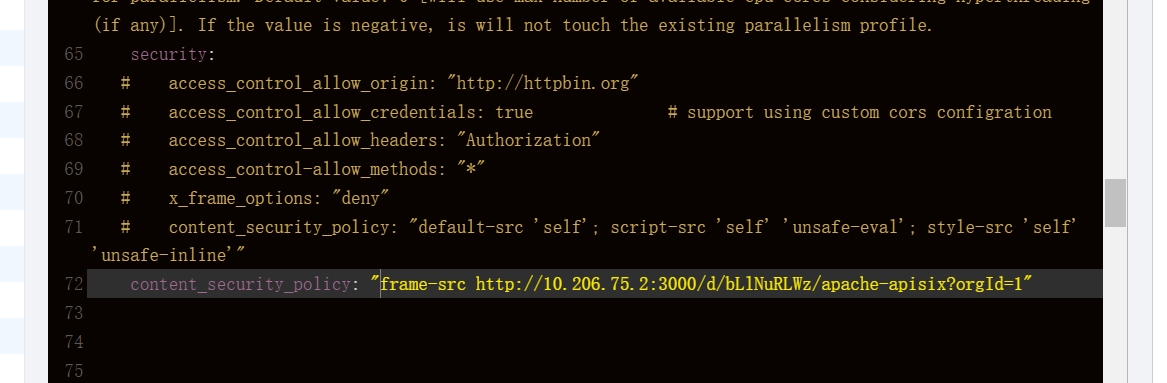
大佬,我配置如图所示,提示配置错误无法启动。能否帮看一下,万分感谢.
--
This is an automated message from the Apache Git Service.
To respond to the message, please log on to GitHub and use the
URL above to go to the specific comment.
To unsubscribe, e-mail: notifications-unsubscribe@apisix.apache.org
For queries about this service, please contact Infrastructure at:
users@infra.apache.org
[GitHub] [apisix] li-zheng-hao commented on issue #7603: help request: apisix cannot display grafana
Posted by GitBox <gi...@apache.org>.
li-zheng-hao commented on issue #7603:
URL: https://github.com/apache/apisix/issues/7603#issuecomment-1203413009

   Solved   refer to : https://github.com/apache/apisix-dashboard/pull/2548/commits/31093bbcfed4861489ed6af625c6a9a7fca65bd4


--
This is an automated message from the Apache Git Service.
To respond to the message, please log on to GitHub and use the
URL above to go to the specific comment.

To unsubscribe, e-mail: notifications-unsubscribe@apisix.apache.org

For queries about this service, please contact Infrastructure at:
users@infra.apache.org
[GitHub] [apisix] vctuscwawo989 commented on issue #7603: help request: apisix cannot display grafana
Posted by GitBox <gi...@apache.org>.
vctuscwawo989 commented on issue #7603:
URL: https://github.com/apache/apisix/issues/7603#issuecomment-1334970936

   > @li-zheng-hao 大佬能看下你是怎么加的配置吗?

   上面有


--
This is an automated message from the Apache Git Service.
To respond to the message, please log on to GitHub and use the
URL above to go to the specific comment.

To unsubscribe, e-mail: notifications-unsubscribe@apisix.apache.org

For queries about this service, please contact Infrastructure at:
users@infra.apache.org
[GitHub] [apisix] li-zheng-hao commented on issue #7603: help request: apisix cannot display grafana
Posted by GitBox <gi...@apache.org>.
li-zheng-hao commented on issue #7603:
URL: https://github.com/apache/apisix/issues/7603#issuecomment-1334971945

   > @li-zheng-hao 大佬能看下你是怎么加的配置吗?

   上面有


--
This is an automated message from the Apache Git Service.
To respond to the message, please log on to GitHub and use the
URL above to go to the specific comment.

To unsubscribe, e-mail: notifications-unsubscribe@apisix.apache.org

For queries about this service, please contact Infrastructure at:
users@infra.apache.org
[GitHub] [apisix] lihanghang404 commented on issue #7603: help request: apisix cannot display grafana
Posted by GitBox <gi...@apache.org>.
lihanghang404 commented on issue #7603:
URL: https://github.com/apache/apisix/issues/7603#issuecomment-1334969810

   @li-zheng-hao  大佬能看下你是怎么加的配置吗?


--
This is an automated message from the Apache Git Service.
To respond to the message, please log on to GitHub and use the
URL above to go to the specific comment.

To unsubscribe, e-mail: notifications-unsubscribe@apisix.apache.org

For queries about this service, please contact Infrastructure at:
users@infra.apache.org