You are viewing a plain text version of this content. The canonical link for it is here.
Posted to commits@echarts.apache.org by GitBox <gi...@apache.org> on 2021/08/19 04:03:12 UTC
[GitHub] [echarts] NiantongDong opened a new issue #15558: Display negative value in Logarithmic axis
NiantongDong opened a new issue #15558:
URL: https://github.com/apache/echarts/issues/15558


   ### What problem does this feature solve?
   In real life, we can find some value that may break the limit of logarithmic value. In the current version, we cannot show any value in the log axis which is negative

   ### What does the proposed API look like?
   axis.min: negative

   <!-- This issue is generated by echarts-issue-helper. DO NOT REMOVE -->
   <!-- This issue is in English. DO NOT REMOVE -->


--
This is an automated message from the Apache Git Service.
To respond to the message, please log on to GitHub and use the
URL above to go to the specific comment.

To unsubscribe, e-mail: commits-unsubscribe@echarts.apache.org

For queries about this service, please contact Infrastructure at:
users@infra.apache.org


---------------------------------------------------------------------
To unsubscribe, e-mail: commits-unsubscribe@echarts.apache.org
For additional commands, e-mail: commits-help@echarts.apache.org
[GitHub] [echarts] 100pah commented on issue #15558: Display negative value in Logarithmic axis
Posted by GitBox <gi...@apache.org>.
100pah commented on issue #15558:
URL: https://github.com/apache/echarts/issues/15558#issuecomment-904007638


   What the graph like do you expect when the value is negative on logarithmic axis?


--
This is an automated message from the Apache Git Service.
To respond to the message, please log on to GitHub and use the
URL above to go to the specific comment.

To unsubscribe, e-mail: commits-unsubscribe@echarts.apache.org

For queries about this service, please contact Infrastructure at:
users@infra.apache.org


---------------------------------------------------------------------
To unsubscribe, e-mail: commits-unsubscribe@echarts.apache.org
For additional commands, e-mail: commits-help@echarts.apache.org
[GitHub] [echarts] echarts-bot[bot] commented on issue #15558: Display negative value in Logarithmic axis
Posted by GitBox <gi...@apache.org>.
echarts-bot[bot] commented on issue #15558:
URL: https://github.com/apache/echarts/issues/15558#issuecomment-901591522


   Hi! We've received your issue and please be patient to get responded. 🎉
   The average response time is expected to be within one day for weekdays.

   In the meanwhile, please make sure that it contains **a minimum reproducible demo** and necessary **images** to illustrate. Otherwise, our committers will ask you to do so.

   *A minimum reproducible demo* should contain as little data and components as possible but can still illustrate your problem. This is the best way for us to reproduce it and solve the problem faster.

   You may also check out the [API](http://echarts.apache.org/api.html) and [chart option](http://echarts.apache.org/option.html) to get the answer.

   If you don't get helped for a long time (over a week) or have an urgent question to ask, you may also send an email to dev@echarts.apache.org. Please attach the issue link if it's a technical question.

   If you are interested in the project, you may also subscribe to our [mailing list](https://echarts.apache.org/en/maillist.html).

   Have a nice day! 🍵


--
This is an automated message from the Apache Git Service.
To respond to the message, please log on to GitHub and use the
URL above to go to the specific comment.

To unsubscribe, e-mail: commits-unsubscribe@echarts.apache.org

For queries about this service, please contact Infrastructure at:
users@infra.apache.org


---------------------------------------------------------------------
To unsubscribe, e-mail: commits-unsubscribe@echarts.apache.org
For additional commands, e-mail: commits-help@echarts.apache.org
[GitHub] [echarts] NiantongDong commented on issue #15558: Display negative value in Logarithmic axis
Posted by GitBox <gi...@apache.org>.
NiantongDong commented on issue #15558:
URL: https://github.com/apache/echarts/issues/15558#issuecomment-904022244
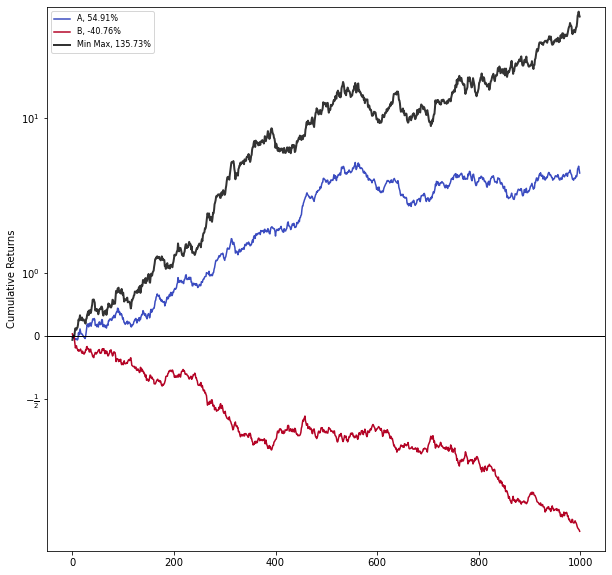
What I want to do is to use the log1p y-axis to represent the certain stock return rate. The rate may be negative and keep going down. If I use type 'log' in echarts, it will not show any value less than 0. If I use type 'value', the graph is incorrect. The idea is that the rate is calculated by Math.log1p(x) and the y-axis value should also be calculated Math.exp(y) so that it can show the correct plot for each value. Here is an example graph I generated using Juptyer and matplotlib.
--
This is an automated message from the Apache Git Service.
To respond to the message, please log on to GitHub and use the
URL above to go to the specific comment.
To unsubscribe, e-mail: commits-unsubscribe@echarts.apache.org
For queries about this service, please contact Infrastructure at:
users@infra.apache.org
---------------------------------------------------------------------
To unsubscribe, e-mail: commits-unsubscribe@echarts.apache.org
For additional commands, e-mail: commits-help@echarts.apache.org