You are viewing a plain text version of this content. The canonical link for it is here.
Posted to commits@echarts.apache.org by GitBox <gi...@apache.org> on 2020/06/02 07:50:23 UTC
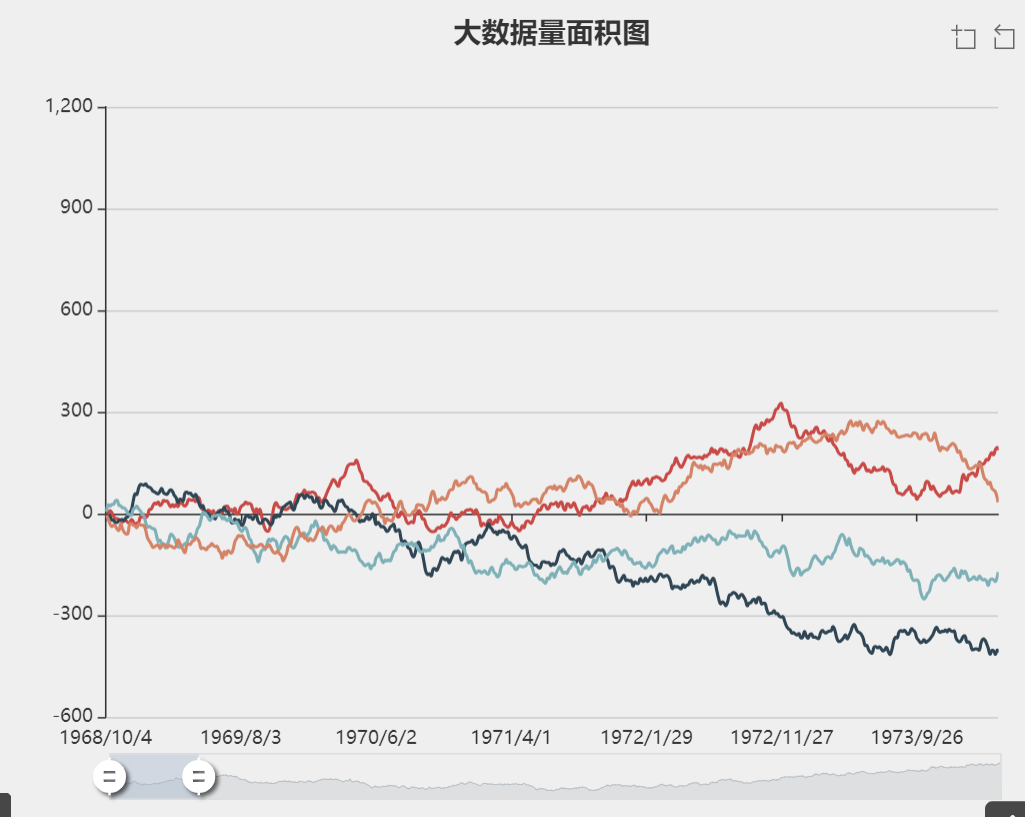
[GitHub] [incubator-echarts] 1713735544 opened a new issue #12734: 大数据量渲染问题
1713735544 opened a new issue #12734:
URL: https://github.com/apache/incubator-echarts/issues/12734
下面这段代码直接粘贴到echarts官网就能执行,但我使用本地的vue执行后,缩放变得卡顿,但是官网上很流畅
var base = +new Date(1968, 9, 3);
var oneDay = 24 * 3600 * 1000;
var date = [];
var data = new Array(4);
data[0] = [Math.random() * 300];
for (var i = 0; i < data.length; i++) {
data[i] = [data[0].length];
}
for (var i = 1; i < 20000; i++) {
var now = new Date((base += oneDay));
date.push(
[now.getFullYear(), now.getMonth() + 1, now.getDate()].join("/")
);
data[0].push(Math.round((Math.random() - 0.5) * 20 + data[0][i - 1]));
}
for (var j = 1; j < data.length; j++) {
for (var i = 1; i < 20000; i++) {
data[j].push(Math.round((Math.random() - 0.5) * 20 + data[j][i - 1]));
}
}
option = {
tooltip: {
trigger: "axis",
position: function(pt) {
return [pt[0], "10%"];
}
},
title: {
left: "center",
text: "大数据量面积图"
},
toolbox: {
feature: {
dataZoom: {
yAxisIndex: "none"
},
restore: {},
saveAsImage: {}
}
},
xAxis: {
type: "category",
boundaryGap: false,
data: date
},
yAxis: {
type: "value",
boundaryGap: [0, "100%"]
},
dataZoom: [
{
type: "inside",
start: 0,
end: 10
},
{
start: 0,
end: 10,
handleIcon:
"M10.7,11.9v-1.3H9.3v1.3c-4.9,0.3-8.8,4.4-8.8,9.4c0,5,3.9,9.1,8.8,9.4v1.3h1.3v-1.3c4.9-0.3,8.8-4.4,8.8-9.4C19.5,16.3,15.6,12.2,10.7,11.9z M13.3,24.4H6.7V23h6.6V24.4z M13.3,19.6H6.7v-1.4h6.6V19.6z",
handleSize: "80%",
handleStyle: {
color: "#fff",
shadowBlur: 3,
shadowColor: "rgba(0, 0, 0, 0.6)",
shadowOffsetX: 2,
shadowOffsetY: 2
}
}
],
series: [
{
name: "模拟数据",
type: "line",
smooth: true,
symbol: "none",
sampling: "average",
lineStyle: {
color: "#C84945" //改变折线颜色
},
data: data[0]
},
{
name: "模拟数据",
type: "line",
smooth: true,
symbol: "none",
sampling: "average",
lineStyle: {
color: "rgb(47, 69, 84)" //改变折线颜色
},
data: data[1]
},
{
name: "模拟数据",
type: "line",
smooth: true,
symbol: "none",
sampling: "average",
lineStyle: {
color: "rgb(125, 177, 183)" //改变折线颜色
},
data: data[2]
},
{
name: "模拟数据",
type: "line",
smooth: true,
symbol: "none",
sampling: "average",
lineStyle: {
color: "rgb(212, 131, 102)" //改变折线颜色
},
data: data[3]
}
]
};
----------------------------------------------------------------
This is an automated message from the Apache Git Service.
To respond to the message, please log on to GitHub and use the
URL above to go to the specific comment.
For queries about this service, please contact Infrastructure at:
users@infra.apache.org
---------------------------------------------------------------------
To unsubscribe, e-mail: commits-unsubscribe@echarts.apache.org
For additional commands, e-mail: commits-help@echarts.apache.org
[GitHub] [incubator-echarts] wf123537200 commented on issue #12734: 大数据量渲染问题
Posted by GitBox <gi...@apache.org>.
wf123537200 commented on issue #12734:
URL: https://github.com/apache/incubator-echarts/issues/12734#issuecomment-637364384


   It feels that the performance consumption of vue component refresh brings,may be analyzed with chrome devtools?


----------------------------------------------------------------
This is an automated message from the Apache Git Service.
To respond to the message, please log on to GitHub and use the
URL above to go to the specific comment.

For queries about this service, please contact Infrastructure at:
users@infra.apache.org


---------------------------------------------------------------------
To unsubscribe, e-mail: commits-unsubscribe@echarts.apache.org
For additional commands, e-mail: commits-help@echarts.apache.org