You are viewing a plain text version of this content. The canonical link for it is here.
Posted to notifications@apisix.apache.org by sp...@apache.org on 2022/09/21 06:05:19 UTC
[apisix] branch master updated: docs: add tutorials docs and fix others docs (#7952)
This is an automated email from the ASF dual-hosted git repository.
spacewander pushed a commit to branch master
in repository https://gitbox.apache.org/repos/asf/apisix.git
The following commit(s) were added to refs/heads/master by this push:
new ec6ea8a06 docs: add tutorials docs and fix others docs (#7952)
ec6ea8a06 is described below
commit ec6ea8a06b3270796ad0507b6c2ff95603fab3e3
Author: Fei Han <97...@users.noreply.github.com>
AuthorDate: Wed Sep 21 14:05:13 2022 +0800
docs: add tutorials docs and fix others docs (#7952)
---
docs/en/latest/config.json | 2 +
docs/en/latest/tutorials/expose-api.md | 123 ++++++++++++++
docs/en/latest/tutorials/observe-your-api.md | 29 ++--
docs/en/latest/tutorials/protect-api.md | 124 ++++++++++++++
docs/zh/latest/config.json | 9 +
docs/zh/latest/terminology/plugin-config.md | 57 +++++--
docs/zh/latest/tutorials/expose-api.md | 126 ++++++++++++++
docs/zh/latest/tutorials/observe-your-api.md | 236 +++++++++++++++++++++++++++
docs/zh/latest/tutorials/protect-api.md | 129 +++++++++++++++
9 files changed, 808 insertions(+), 27 deletions(-)
diff --git a/docs/en/latest/config.json b/docs/en/latest/config.json
index 8803b0e94..baee9e8d0 100644
--- a/docs/en/latest/config.json
+++ b/docs/en/latest/config.json
@@ -17,6 +17,8 @@
"type": "category",
"label": "Tutorials",
"items": [
+ "tutorials/expose-api",
+ "tutorials/protect-api",
"tutorials/observe-your-api"
]
},
diff --git a/docs/en/latest/tutorials/expose-api.md b/docs/en/latest/tutorials/expose-api.md
new file mode 100644
index 000000000..18f016ff2
--- /dev/null
+++ b/docs/en/latest/tutorials/expose-api.md
@@ -0,0 +1,123 @@
+---
+title: Expose API
+keywords:
+ - API Gateway
+ - Apache APISIX
+ - Expose Service
+description: This article describes how to publish services through the API Gateway Apache APISIX.
+---
+
+<!--
+#
+# Licensed to the Apache Software Foundation (ASF) under one or more
+# contributor license agreements. See the NOTICE file distributed with
+# this work for additional information regarding copyright ownership.
+# The ASF licenses this file to You under the Apache License, Version 2.0
+# (the "License"); you may not use this file except in compliance with
+# the License. You may obtain a copy of the License at
+#
+# http://www.apache.org/licenses/LICENSE-2.0
+#
+# Unless required by applicable law or agreed to in writing, software
+# distributed under the License is distributed on an "AS IS" BASIS,
+# WITHOUT WARRANTIES OR CONDITIONS OF ANY KIND, either express or implied.
+# See the License for the specific language governing permissions and
+# limitations under the License.
+#
+-->
+
+This article will guide you through APISIX's upstream, routing, and service concepts and introduce how to publish your services through APISIX.
+
+## Concept introduction
+
+### Upstream
+
+[Upstream](../terminology/upstream.md) is a virtual host abstraction that performs load balancing on a given set of service nodes according to the configured rules.
+
+The role of the Upstream is to load balance the service nodes according to the configuration rules, and Upstream information can be directly configured to the Route or Service.
+
+When multiple routes or services refer to the same upstream, you can create an upstream object and use the upstream ID in the Route or Service to reference the upstream to reduce maintenance pressure.
+
+### Route
+
+[Routes](../terminology/route.md) match the client's request based on defined rules, load and execute the corresponding plugins, and forwards the request to the specified Upstream.
+
+### Service
+
+A [Service](../terminology/service.md) is an abstraction of an API (which can also be understood as a set of Route abstractions). It usually corresponds to an upstream service abstraction.
+
+## Prerequisites
+
+Please make sure you have [installed Apache APISIX](../installation-guide.md) before doing the following.
+
+## Expose your service
+
+1. Create an Upstream.
+
+Create an Upstream service containing `httpbin.org` that you can use for testing. This is a return service that will return the parameters we passed in the request.
+
+```
+curl "http://127.0.0.1:9180/apisix/admin/upstreams/1" \
+-H "X-API-KEY: edd1c9f034335f136f87ad84b625c8f1" -X PUT -d '
+{
+ "type": "roundrobin",
+ "nodes": {
+ "httpbin.org:80": 1
+ }
+}'
+```
+
+In this command, we specify the Admin API Key of Apache APISIX as `edd1c9f034335f136f87ad84b625c8f1`, use `roundrobin` as the load balancing mechanism, and set `httpbin.org:80` as the upstream service. To bind this upstream to a route, `upstream_id` needs to be set to `1` here. Here you can specify multiple upstreams under `nodes` to achieve load balancing.
+
+For more information, please refer to [Upstream](../terminology/upstream.md).
+
+2. Create a Route.
+
+```shell
+curl "http://127.0.0.1:9180/apisix/admin/routes/1" \
+-H "X-API-KEY: edd1c9f034335f136f87ad84b625c8f1" -X PUT -d '
+{
+ "methods": ["GET"],
+ "host": "example.com",
+ "uri": "/anything/*",
+ "upstream_id": "1"
+}'
+```
+
+:::note
+
+Adding an `upstream` object to your route can achieve the above effect.
+
+```shell
+curl "http://127.0.0.1:9180/apisix/admin/routes/1" \
+-H "X-API-KEY: edd1c9f034335f136f87ad84b625c8f1" -X PUT -d '
+{
+ "methods": ["GET"],
+ "host": "example.com",
+ "uri": "/anything/*",
+ "upstream": {
+ "type": "roundrobin",
+ "nodes": {
+ "httpbin.org:80": 1
+ }
+ }
+}'
+```
+
+:::
+
+3. Test
+
+After creating the Route, you can test the Service with the following command:
+
+```
+curl -i -X GET "http://127.0.0.1:9080/get?foo1=bar1&foo2=bar2" -H "Host: httpbin.org"
+```
+
+APISIX will forward the request to `http://httpbin.org:80/anything/foo?arg=10`.
+
+## More Tutorials
+
+You can refer to [Protect API](./protect-api.md) to protect your API.
+
+You can also use APISIX's [Plugin](../terminology/plugin.md) to achieve more functions.
diff --git a/docs/en/latest/tutorials/observe-your-api.md b/docs/en/latest/tutorials/observe-your-api.md
index e97223b3b..2e4b94529 100644
--- a/docs/en/latest/tutorials/observe-your-api.md
+++ b/docs/en/latest/tutorials/observe-your-api.md
@@ -80,7 +80,7 @@ Before enabling our plugins we need to install Apache APISIX, create a route, an
- [google-cloud-logging](https://apisix.apache.org/docs/apisix/plugins/google-cloud-logging)
-And you can see the [full list](https://apisix.apache.org/docs/apisix/plugins/zipkin) on the official website of Apache APISIX. Now for demo purposes, let's choose a simple but mostly used _http-logger_ plugin that is capable of sending API Log data requests to HTTP/HTTPS servers or sends as JSON objects to Monitoring tools. We can assume that a route and an upstream are created. You can learn how to set up them in the **[Getting started with Apache APISIX](https://youtu.be/dUOjJkb61so) [...]
+And you can see the [full list](../plugins/http-logger.md) on the official website of Apache APISIX. Now for demo purposes, let's choose a simple but mostly used _http-logger_ plugin that is capable of sending API Log data requests to HTTP/HTTPS servers or sends as JSON objects to Monitoring tools. We can assume that a route and an upstream are created. You can learn how to set up them in the **[Getting started with Apache APISIX](https://youtu.be/dUOjJkb61so)** video tutorial. Also, yo [...]
You can generate a mock HTTP server at [mockbin.com](https://mockbin.org/) to record and view the logs. Note that we also bind the route to an upstream (You can refer to this documentation to learn about more [core concepts of Apache APISIX](https://apisix.apache.org/docs/apisix/architecture-design/apisix)).
@@ -88,7 +88,8 @@ The following is an example of how to enable the http-logger for a specific rout
```shell
-curl http://127.0.0.1:9080/apisix/admin/routes/1 -H 'X-API-KEY: edd1c9f034335f136f87ad84b625c8f1' -X PUT -d '
+curl http://127.0.0.1:9180/apisix/admin/routes/1 \
+-H 'X-API-KEY: edd1c9f034335f136f87ad84b625c8f1' -X PUT -d '
{
"plugins": {
"http-logger": {
@@ -101,7 +102,9 @@ curl http://127.0.0.1:9080/apisix/admin/routes/1 -H 'X-API-KEY: edd1c9f034335f13
```
-> To http-logger plugin settings, your can just put your mock server URI address like below:
+:::note
+
+To `http-logger` plugin settings, your can just put your mock server URI address like below:
```json
{
@@ -109,6 +112,8 @@ curl http://127.0.0.1:9080/apisix/admin/routes/1 -H 'X-API-KEY: edd1c9f034335f13
}
```
+:::
+
Once we get a successful response from APISIX server, we can send a request to this _get_ endpoint to generate logs.
```shell
@@ -130,7 +135,8 @@ Apache APISIX API Gateway also offers [prometheus-plugin](https://apisix.apache.
Let’s enable prometheus-plugin for our route:
```shell
-curl http://127.0.0.1:9080/apisix/admin/routes/1 -H 'X-API-KEY: edd1c9f034335f136f87ad84b625c8f1' -X PUT -d '
+curl http://127.0.0.1:9180/apisix/admin/routes/1 \
+-H 'X-API-KEY: edd1c9f034335f136f87ad84b625c8f1' -X PUT -d '
{
"uri": "/get",
"plugins": {
@@ -140,7 +146,7 @@ curl http://127.0.0.1:9080/apisix/admin/routes/1 -H 'X-API-KEY: edd1c9f034335f1
}'
```
-We fetch the metric data from the specified URL `/apisix/prometheus/`metrics.
+We fetch the metric data from the specified URL `/apisix/prometheus/metrics`.
```shell
curl -i http://127.0.0.1:9091/apisix/prometheus/metrics
@@ -185,9 +191,9 @@ In addition to this, you can view the Grafana dashboard running in your local in
You can also check two other plugins for metrics:
-- [Node status Plugin](https://apisix.apache.org/docs/apisix/plugins/node-status/)
+- [Node status Plugin](../plugins/node-status.md)
-- [Datadog Plugin](https://apisix.apache.org/docs/apisix/plugins/opentelemetry)
+- [Datadog Plugin](../plugins/datadog.md)
## Tracing
@@ -195,10 +201,11 @@ The third is **tracing** or distributed tracing allows you to understand the lif
[Zipkin](https://zipkin.io/) an open-source distributed tracing system. [APISIX plugin](https://apisix.apache.org/docs/apisix/plugins/zipkin) is supported to collect tracing and report to Zipkin Collector based on [Zipkin API specification](https://zipkin.io/pages/instrumenting.html).
-Here’s an example to enable the _zipkin plugin_ on the specified route:
+Here’s an example to enable the `zipkin` plugin on the specified route:
```shell
-curl http://127.0.0.1:9080/apisix/admin/routes/1 -H 'X-API-KEY: edd1c9f034335f136f87ad84b625c8f1' -X PUT -d '
+curl http://127.0.0.1:9180/apisix/admin/routes/1 \
+-H 'X-API-KEY: edd1c9f034335f136f87ad84b625c8f1' -X PUT -d '
{
"methods": [
"GET"
@@ -242,9 +249,9 @@ As you noticed, the recent traces were exposed in the above pictures.
You can also check two other plugins for tracing:
-- [Skywalking-plugin](https://apisix.apache.org/docs/apisix/plugins/skywalking)
+- [Skywalking-plugin](../plugins/skywalking.md)
-- [Opentelemetry-plugin](https://apisix.apache.org/docs/apisix/plugins/opentelemetry)
+- [Opentelemetry-plugin](../plugins/opentelemetry.md)
## Summary
diff --git a/docs/en/latest/tutorials/protect-api.md b/docs/en/latest/tutorials/protect-api.md
new file mode 100644
index 000000000..dd0d67e15
--- /dev/null
+++ b/docs/en/latest/tutorials/protect-api.md
@@ -0,0 +1,124 @@
+---
+title: Protect API
+keywords:
+ - API Gateway
+ - Apache APISIX
+ - Rate Limit
+ - Protect API
+description: This article describes how to secure your API with the rate limiting plugin for API Gateway Apache APISIX.
+---
+
+<!--
+#
+# Licensed to the Apache Software Foundation (ASF) under one or more
+# contributor license agreements. See the NOTICE file distributed with
+# this work for additional information regarding copyright ownership.
+# The ASF licenses this file to You under the Apache License, Version 2.0
+# (the "License"); you may not use this file except in compliance with
+# the License. You may obtain a copy of the License at
+#
+# http://www.apache.org/licenses/LICENSE-2.0
+#
+# Unless required by applicable law or agreed to in writing, software
+# distributed under the License is distributed on an "AS IS" BASIS,
+# WITHOUT WARRANTIES OR CONDITIONS OF ANY KIND, either express or implied.
+# See the License for the specific language governing permissions and
+# limitations under the License.
+#
+-->
+
+This article describes secure your API with the rate limiting plugin for API Gateway Apache APISIX.
+
+## Concept introduction
+
+### Plugin
+
+This represents the configuration of the plugins that are executed during the HTTP request/response lifecycle. A [Plugin](./terminology/plugin.md) configuration can be bound directly to a Route, a Service, a Consumer or a Plugin Config.
+
+:::note
+
+If [Route](./terminology/route.md), [Service](./terminology/service.md), [Plugin Config](./terminology/plugin-config.md) or Consumer are all bound to the same for plugins, only one plugin configuration will take effect. The priority of plugin configurations is: Consumer > Route > Plugin Config > Service. At the same time, there are 6 stages involved in the plugin execution process, namely `rewrite`, `access`, `before_proxy`, `header_filter`, `body_filter` and `log`.
+
+:::
+
+## Preconditions
+
+Before following this tutorial, ensure you have [exposed the service](./expose-api.md).
+
+## Protect your API
+
+We can use rate limits to limit our API services to ensure the stable operation of API services and avoid system crashes caused by some sudden traffic. We can restrict as follows:
+
+1. Limit the request rate;
+2. Limit the number of requests per unit time;
+3. Delay request;
+4. Reject client requests;
+5. Limit the rate of response data.
+
+APISIX provides several plugins for limiting current and speed, including [limit-conn](./plugins/limit-conn.md), [limit-count](./plugins/limit-count.md), [limit- req](./plugins/limit-req.md) and other plugins.
+
+- The `limit-conn` Plugin limits the number of concurrent requests to your services.
+- The `limit-req` Plugin limits the number of requests to your service using the leaky bucket algorithm.
+- The `limit-count` Plugin limits the number of requests to your service by a given count per time.
+
+Next, we will use the `limit-count` plugin as an example to show you how to protect your API with a rate limit plugin:
+
+1. Create a Route.
+
+```shell
+curl -i http://127.0.0.1:9180/apisix/admin/routes/1 \
+-H 'X-API-KEY: edd1c9f034335f136f87ad84b625c8f1' -X PUT -d '
+{
+ "uri": "/index.html",
+ "plugins": {
+ "limit-count": {
+ "count": 2,
+ "time_window": 60,
+ "rejected_code": 503,
+ "key_type": "var",
+ "key": "remote_addr"
+ }
+ },
+ "upstream_id": "1"
+ }
+}'
+```
+
+In the above configuration, a Route with ID `1` is created using the upstream made in [Expose Service](./expose-api.md), and the `limit-count` plugin is enabled. The plugin only allows the client to access the upstream service `2` times within `60` seconds. If more than two times, the `503` error code will be returned.
+
+2. Test
+
+```shell
+curl http://127.0.0.1:9080/index.html
+```
+
+After using the above command to access three times in a row, the following error will appear:
+
+```
+<html>
+<head><title>503 Service Temporarily Unavailable</title></head>
+<body>
+<center><h1>503 Service Temporarily Unavailable</h1></center>
+<hr><center>openresty</center>
+</body>
+</html>
+```
+
+If the above result is returned, the `limit-count` plugin has taken effect and protected your API.
+
+## More Traffic plugins
+
+In addition to providing plugins for limiting current and speed, APISIX also offers many other plugins to meet the needs of actual scenarios:
+
+- [proxy-cache](./plugins/proxy-cache.md): This plugin provides the ability to cache backend response data. It can be used with other plugins. The plugin supports both disk and memory-based caching. Currently, the data to be cached can be specified according to the response code and request mode, and more complex caching strategies can also be configured through the no_cache and cache_bypass attributes.
+- [request-validation](./plugins/request-validation.md): This plugin is used to validate requests forwarded to upstream services in advance.
+- [proxy-mirror](./plugins/proxy-mirror.md): This plugin provides the ability to mirror client requests. Traffic mirroring is copying the real online traffic to the mirroring service, so that the online traffic or request content can be analyzed in detail without affecting the online service.
+- [api-breaker](./plugins/api-breaker.md): This plugin implements an API circuit breaker to help us protect upstream business services.
+- [traffic-split](./plugins/traffic-split.md): You can use this plugin to gradually guide the percentage of traffic between upstreams to achieve blue-green release and grayscale release.
+- [request-id](./plugins/request-id.md): The plugin adds a `unique` ID to each request proxy through APISIX for tracking API requests.
+- [proxy-control](./plugins/proxy-control.md): This plugin can dynamically control the behavior of NGINX proxy.
+- [client-control](./plugins/client-control.md): This plugin can dynamically control how NGINX handles client requests by setting an upper limit on the client request body size.
+
+## More Tutorials
+
+You can refer to the [Observe API](./observe-your-api.md) document to monitor APISIX, collect logs, and track.
diff --git a/docs/zh/latest/config.json b/docs/zh/latest/config.json
index 778da9f65..260f52bb4 100644
--- a/docs/zh/latest/config.json
+++ b/docs/zh/latest/config.json
@@ -13,6 +13,15 @@
"type": "doc",
"id": "architecture-design/apisix"
},
+ {
+ "type": "category",
+ "label": "Tutorials",
+ "items": [
+ "tutorials/expose-api",
+ "tutorials/protect-api",
+ "tutorials/observe-your-api"
+ ]
+ },
{
"type": "category",
"label": "Terminology",
diff --git a/docs/zh/latest/terminology/plugin-config.md b/docs/zh/latest/terminology/plugin-config.md
index 4067033a6..599b88078 100644
--- a/docs/zh/latest/terminology/plugin-config.md
+++ b/docs/zh/latest/terminology/plugin-config.md
@@ -1,5 +1,11 @@
---
title: Plugin Config
+keywords:
+ - API 网关
+ - Apache APISIX
+ - 插件配置
+ - Plugin Config
+description: Plugin Config 对象,可以用于创建一组通用的插件配置,并在路由中使用这组配置。
---
<!--
@@ -21,15 +27,20 @@ title: Plugin Config
#
-->
-如果你想要复用一组通用的插件配置,你可以把它们提取成一个 Plugin config,并绑定到对应的路由上。
+## 描述
-举个例子,你可以这么做:
+在很多情况下,我们在不同的路由中会使用相同的插件规则,此时就可以通过 `Plugin Config` 来设置这些规则。`plugins` 的配置可以通过 Admin API `/apisix/admin/plugin_configs` 进行单独配置,在路由中使用`plugin_config_id` 与之进行关联。插件配置属于一组通用插件配置的抽象。
+
+## 配置步骤
+
+你可以参考如下步骤将 Plugin Config 绑定在路由上。
+
+1. 创建 Plugin config。
```shell
-# 创建 Plugin config
-$ curl http://127.0.0.1:9180/apisix/admin/plugin_configs/1 -H 'X-API-KEY: edd1c9f034335f136f87ad84b625c8f1' -X PUT -i -d '
+curl http://127.0.0.1:9180/apisix/admin/plugin_configs/1 -H 'X-API-KEY: edd1c9f034335f136f87ad84b625c8f1' -X PUT -i -d '
{
- "desc": "吾乃插件配置 1",
+ "desc": "enable limit-count plugin",
"plugins": {
"limit-count": {
"count": 2,
@@ -38,9 +49,13 @@ $ curl http://127.0.0.1:9180/apisix/admin/plugin_configs/1 -H 'X-API-KEY: edd1c9
}
}
}'
+```
+
+2. 创建路由并绑定 `Plugin Config 1`。
-# 绑定到路由上
-$ curl http://127.0.0.1:9180/apisix/admin/routes/1 -H 'X-API-KEY: edd1c9f034335f136f87ad84b625c8f1' -X PUT -i -d '
+```
+curl http://127.0.0.1:9180/apisix/admin/routes/1 \
+-H 'X-API-KEY: edd1c9f034335f136f87ad84b625c8f1' -X PUT -i -d '
{
"uris": ["/index.html"],
"plugin_config_id": 1,
@@ -55,14 +70,19 @@ $ curl http://127.0.0.1:9180/apisix/admin/routes/1 -H 'X-API-KEY: edd1c9f034335f
如果找不到对应的 Plugin config,该路由上的请求会报 503 错误。
-如果这个路由已经配置了 `plugins`,那么 Plugin config 里面的插件配置会合并进去。
+## 注意事项
+
+如果路由中已经配置了 `plugins`,那么 Plugin Config 里面的插件配置将会与 `plugins` 合并。
+
相同的插件不会覆盖掉 `plugins` 原有的插件。
-举个例子:
+例如:
-```
+```shell
+curl http://127.0.0.1:9180/apisix/admin/plugin_configs/1 \
+-H 'X-API-KEY: edd1c9f034335f136f87ad84b625c8f1' -X PUT -i -d '
{
- "desc": "吾乃插件配置 1",
+ "desc": "enable ip-restruction and limit-count plugin",
"plugins": {
"ip-restriction": {
"whitelist": [
@@ -79,9 +99,11 @@ $ curl http://127.0.0.1:9180/apisix/admin/routes/1 -H 'X-API-KEY: edd1c9f034335f
}
```
-加上
+在路由中引入 Plugin Config:
-```
+```shell
+curl http://127.0.0.1:9180/apisix/admin/routes/1 \
+-H 'X-API-KEY: edd1c9f034335f136f87ad84b625c8f1' -X PUT -i -d '
{
"uris": ["/index.html"],
"plugin_config_id": 1,
@@ -106,9 +128,11 @@ $ curl http://127.0.0.1:9180/apisix/admin/routes/1 -H 'X-API-KEY: edd1c9f034335f
}
```
-等于
+最后实现的效果如下:
-```
+```shell
+curl http://127.0.0.1:9180/apisix/admin/routes/1 \
+-H 'X-API-KEY: edd1c9f034335f136f87ad84b625c8f1' -X PUT -i -d '
{
"uris": ["/index.html"],
"upstream": {
@@ -131,7 +155,8 @@ $ curl http://127.0.0.1:9180/apisix/admin/routes/1 -H 'X-API-KEY: edd1c9f034335f
"limit-count": {
"count": 20,
"time_window": 60,
- "rejected_code": 503
+ "rejected_code": 503,
+ "key": "remote_addr"
}
}
}
diff --git a/docs/zh/latest/tutorials/expose-api.md b/docs/zh/latest/tutorials/expose-api.md
new file mode 100644
index 000000000..0f03f5374
--- /dev/null
+++ b/docs/zh/latest/tutorials/expose-api.md
@@ -0,0 +1,126 @@
+---
+title: 发布 API
+keywords:
+ - API 网关
+ - Apache APISIX
+ - 发布路由
+ - 创建服务
+description: 本文介绍了如何通过 Apache APISIX 发布服务和路由。
+---
+
+<!--
+#
+# Licensed to the Apache Software Foundation (ASF) under one or more
+# contributor license agreements. See the NOTICE file distributed with
+# this work for additional information regarding copyright ownership.
+# The ASF licenses this file to You under the Apache License, Version 2.0
+# (the "License"); you may not use this file except in compliance with
+# the License. You may obtain a copy of the License at
+#
+# http://www.apache.org/licenses/LICENSE-2.0
+#
+# Unless required by applicable law or agreed to in writing, software
+# distributed under the License is distributed on an "AS IS" BASIS,
+# WITHOUT WARRANTIES OR CONDITIONS OF ANY KIND, either express or implied.
+# See the License for the specific language governing permissions and
+# limitations under the License.
+#
+-->
+
+## 描述
+
+本文将引导你了解 APISIX 的上游、路由以及服务的概念,并介绍如何通过 APISIX 发布你的 API。
+
+## 概念介绍
+
+### 上游
+
+[Upstream](../terminology/upstream.md) 也称为上游,上游是对虚拟主机的抽象,即应用层服务或节点的抽象。
+
+上游的作用是按照配置规则对服务节点进行负载均衡,它的地址信息可以直接配置到路由或服务上。当多个路由或服务引用同一个上游时,可以通过创建上游对象,在路由或服务中使用上游的 ID 方式引用上游,减轻维护压力。
+
+### 路由
+
+[Route](../terminology/route.md) 也称为路由,是 APISIX 中最基础和最核心的资源对象。
+
+APISIX 可以通过路由定义规则来匹配客户端请求,根据匹配结果加载并执行相应的[插件](./terminology/plugin.md),最后把请求转发给到指定的上游服务。路由中主要包含三部分内容:匹配规则、插件配置和上游信息。
+
+### 服务
+
+[Service](../terminology/service.md) 也称为服务,是某类 API 的抽象(也可以理解为一组 Route 的抽象)。它通常与上游服务抽象是一一对应的,Route 与 Service 之间,通常是 N:1 的关系。
+
+## 前提条件
+
+在进行如下操作前,请确保你已经通过 Docker [启动 APISIX](../installation-guide.md)。
+
+## 公开你的服务
+
+1. 创建上游。
+
+创建一个包含 `httpbin.org` 的上游服务,你可以使用它进行测试。这是一个返回服务,它将返回我们在请求中传递的参数。
+
+```shell
+curl "http://127.0.0.1:9180/apisix/admin/upstreams/1" \
+-H "X-API-KEY: edd1c9f034335f136f87ad84b625c8f1" -X PUT -d '
+{
+ "type": "roundrobin",
+ "nodes": {
+ "httpbin.org:80": 1
+ }
+}'
+```
+
+在该命令中,我们指定了 Apache APISIX 的 Admin API Key 为 `edd1c9f034335f136f87ad84b625c8f1`,并且使用 `roundrobin` 作为负载均衡机制,并设置了 `httpbin.org:80` 为上游服务。为了将该上游绑定到路由,此处需要把 `upstream_id` 设置为 `1`。此处你可以在 `nodes` 下指定多个上游,以达到负载均衡的效果。
+
+如需了解更多信息,请参考[上游](../terminology/upstream.md)。
+
+2. 创建路由。
+
+```shell
+curl "http://127.0.0.1:9180/apisix/admin/routes/1" \
+-H "X-API-KEY: edd1c9f034335f136f87ad84b625c8f1" -X PUT -d '
+{
+ "methods": ["GET"],
+ "host": "example.com",
+ "uri": "/anything/*",
+ "upstream_id": "1"
+}'
+```
+
+:::note 注意
+
+创建上游非必须步骤,你可以通过在路由中,添加 `upstream` 对象,达到上述的效果。例如:
+
+```shell
+curl "http://127.0.0.1:9180/apisix/admin/routes/1" \
+-H "X-API-KEY: edd1c9f034335f136f87ad84b625c8f1" -X PUT -d '
+{
+ "methods": ["GET"],
+ "host": "example.com",
+ "uri": "/anything/*",
+ "upstream": {
+ "type": "roundrobin",
+ "nodes": {
+ "httpbin.org:80": 1
+ }
+ }
+}'
+```
+
+:::
+
+3. 测试路由。
+
+在创建完成路由后,你可以通过以下命令测试路由是否正常:
+
+```
+curl -i -X GET "http://127.0.0.1:9080/get?foo1=bar1&foo2=bar2" -H "Host: httpbin.org"
+```
+
+该请求将被 APISIX 转发到 `http://httpbin.org:80/anything/foo?arg=10`。
+
+## 更多教程
+
+你可以查看[保护 API](./protect-api.md) 来保护你的 API。
+
+接下来,你可以通过 APISIX 的一些[插件](./plugins/batch-requests.md),实现更多功能。
diff --git a/docs/zh/latest/tutorials/observe-your-api.md b/docs/zh/latest/tutorials/observe-your-api.md
new file mode 100644
index 000000000..d65aca50c
--- /dev/null
+++ b/docs/zh/latest/tutorials/observe-your-api.md
@@ -0,0 +1,236 @@
+---
+title: 监控 API
+keywords:
+ - API 网关
+ - Apache APISIX
+ - 可观测性
+ - 监控
+ - 插件
+description: 本文介绍了 API 网关 Apache APISIX 可观察性插件并了解如何设置这些插件。
+---
+
+<!--
+#
+# Licensed to the Apache Software Foundation (ASF) under one or more
+# contributor license agreements. See the NOTICE file distributed with
+# this work for additional information regarding copyright ownership.
+# The ASF licenses this file to You under the Apache License, Version 2.0
+# (the "License"); you may not use this file except in compliance with
+# the License. You may obtain a copy of the License at
+#
+# http://www.apache.org/licenses/LICENSE-2.0
+#
+# Unless required by applicable law or agreed to in writing, software
+# distributed under the License is distributed on an "AS IS" BASIS,
+# WITHOUT WARRANTIES OR CONDITIONS OF ANY KIND, either express or implied.
+# See the License for the specific language governing permissions and
+# limitations under the License.
+#
+-->
+
+APISIX 中提供了很多具有丰富功能的可观测性插件。你可以通过使用和设置这些插件,来了解 API 行为,进而使整个业务流程更加清晰。
+
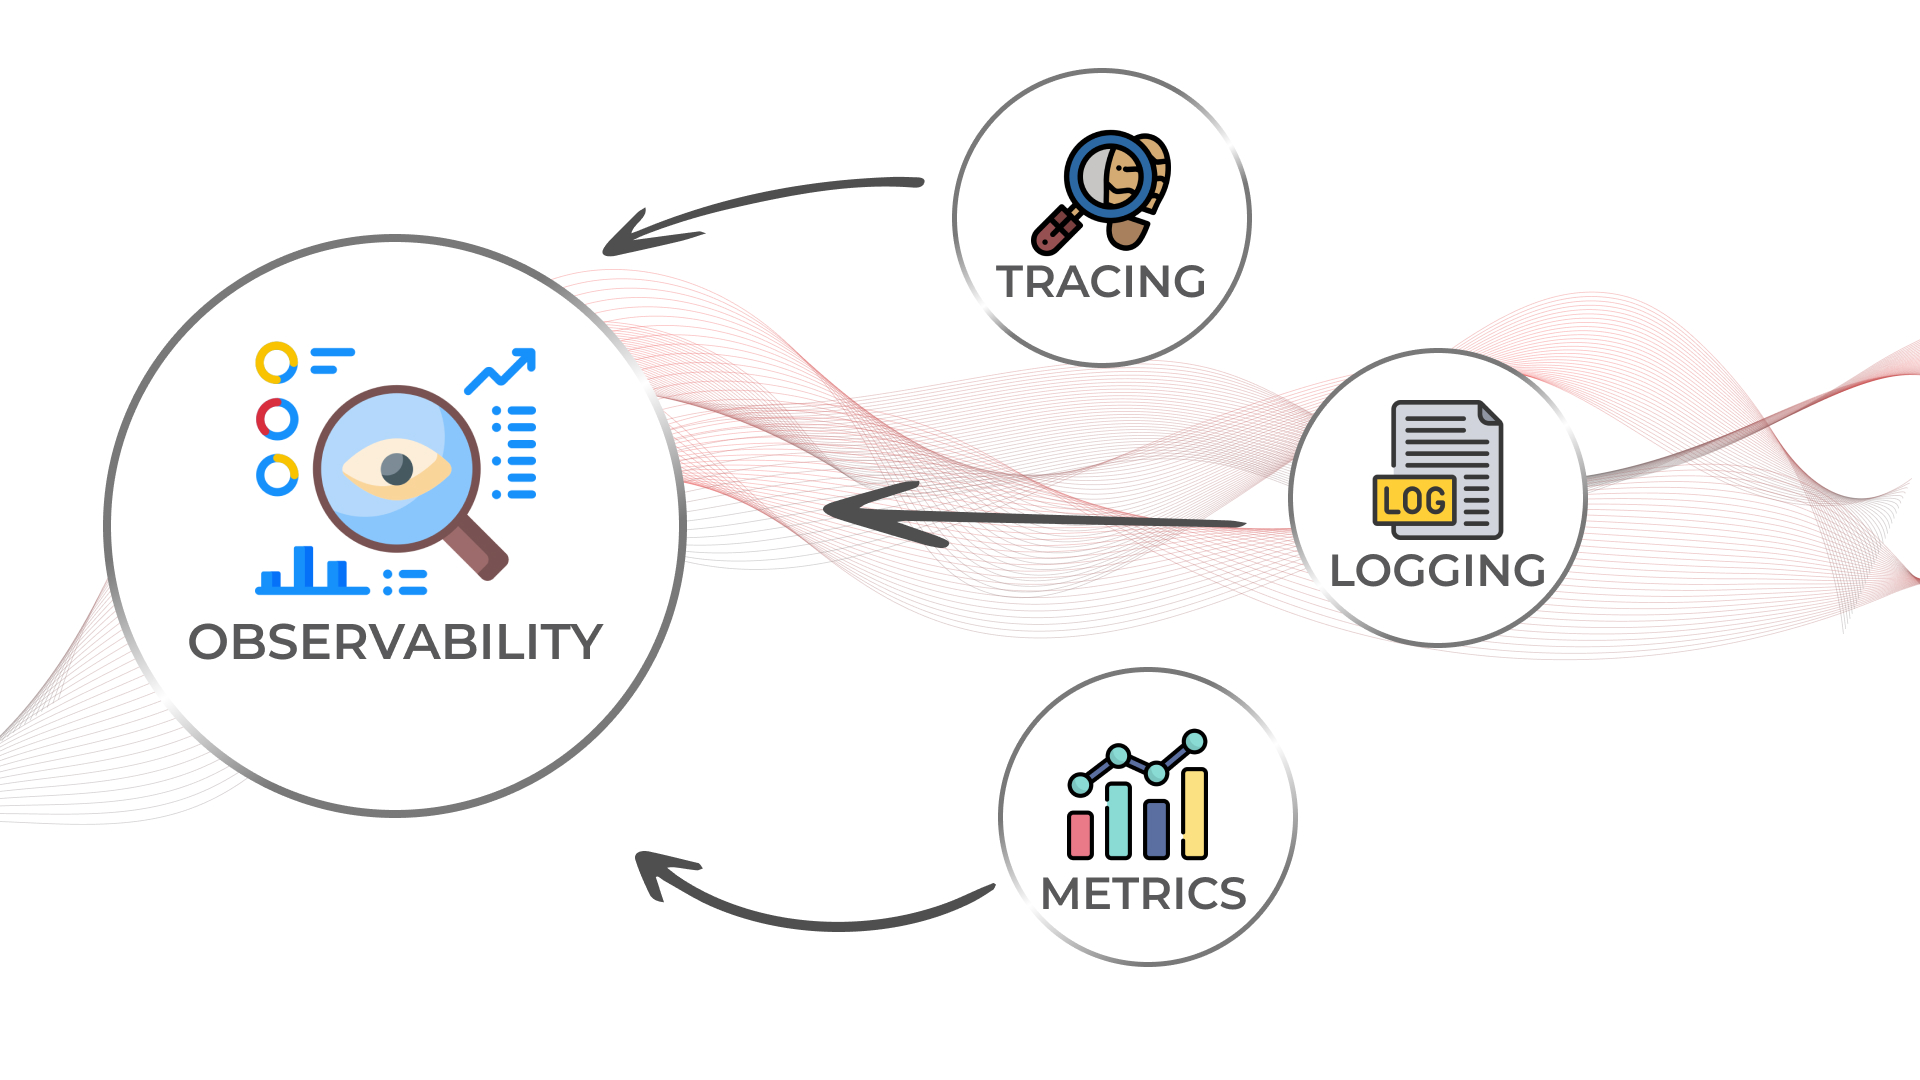
+## API 可观测性
+
+**API 可观测性**已经成为 API 开发的一部分,因为它解决了与 API 一致性、可靠性和快速迭代 API 功能的相关问题。可观测性可分为三个关键部分:日志、指标、链路追踪,接下来让我们逐个了解它们。
+
+
+
+## 前提条件
+
+在进行该教程之前,请确保你已经[公开服务](./expose-api.md)。
+
+## 日志
+
+在 APISIX 中,**日志**可分为访问日志和错误日志。访问日志主要记录了每个请求的上下文信息,错误日志则是 APISIX 运行打印的日志信息,包括 NGINX 和插件相关的信息。APISIX 的日志存储在 `./apisix/logs/` 目录下。当然你可以通过一些 APISIX 的日志插件,将 APISIX 的日志发送到指定的日志服务中,APISIX 提供了以下插件:
+
+- [http-logger](../plugins/http-logger.md)
+- [skywalking-logger](../plugins/skywalking-logger.md)
+- [tcp-logger](../plugins/tcp-logger.md)
+- [kafka-logger](../plugins/kafka-logger.md)
+- [rocketmq-logger](../plugins/rocketmq-logger.md)
+- [udp-logger](../plugins/udp-logger.md)
+- [clickhouse-logger](../plugins/clickhouse-logger.md)
+- [error-logger](../plugins/error-log-logger.md)
+- [google-cloud-logging](../plugins/google-cloud-logging.md)
+
+你可以在 APISIX [插件中心](../plugins/http-logger.md) 查看 APISIX 支持的所有日志插件。接下来我们将使用 `http-logger` 插件为你演示如何将 APISIX 的日志数据发送到 HTPP/HTTPS 服务器中。
+
+:::note 注意
+
+你可以使用 [mockbin.com](https://mockbin.org/) 生成一个模拟的 HTTP 服务器来存储和查看日志。
+
+:::
+
+以下示例展示了在指定路由上启动 `http-logger` 的示例。
+
+```shell
+
+curl http://127.0.0.1:9180/apisix/admin/routes/1 \
+-H 'X-API-KEY: edd1c9f034335f136f87ad84b625c8f1' -X PUT -d '
+{
+ "plugins": {
+ "http-logger": {
+ "uri": "http://mockbin.org/bin/5451b7cd-af27-41b8-8df1-282ffea13a61"
+ }
+ },
+ "upstream_id": "1",
+ "uri": "/get"
+}'
+
+```
+
+:::note 注意
+
+你可以通过修改 `uri` 属性,将上述 `http-logger` 的服务器地址更换为你的服务器地址:
+
+```json
+{
+ "uri": "http://mockbin.org/bin/5451b7cd-af27-41b8-8df1-282ffea13a61"
+}
+```
+
+:::
+
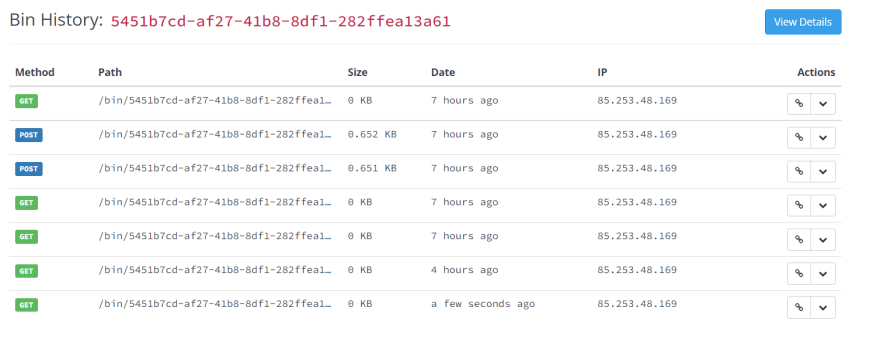
+创建成功后,你可以通过以下命令向 `get` 端点发送请求以生成日志。
+
+```shell
+curl -i http://127.0.0.1:9080/get
+```
+
+请求成功后,你可以单击[模拟服务器链接](http://mockbin.org/bin/5451b7cd-af27-41b8-8df1-282ffea13a61/log)查看访问日志。
+
+
+
+## 指标
+
+**指标**是在⼀段时间内测量的数值。与⽇志不同,指标在默认情况下是结构化的,这使得查询和优化存储变得更加容易。而 APISIX 也提供了 [Prometheus](../plugins/prometheus.md) 的插件来获取你的 API 指标,并在 Prometheus 中暴露它们。通过使用 APISIX 提供的 Grafana 仪表板元数据,并从 Prometheus 中获取指标,更加方便地监控你的 API。
+
+你可以通过以下命令启用 `prometheus` 插件:
+
+```shell
+curl http://127.0.0.1:9180/apisix/admin/routes/1 \
+-H 'X-API-KEY: edd1c9f034335f136f87ad84b625c8f1' -X PUT -d '
+{
+ "uri": "/get",
+ "plugins": {
+ "prometheus": {}
+ },
+ "upstream_id": "1"
+}'
+```
+
+启用成功后,你可以通过 `/apisix/prometheus/metrics` 接口获取 APISIX 的指标。
+
+```shell
+curl -i http://127.0.0.1:9091/apisix/prometheus/metrics
+```
+
+返回结果如下:
+
+```text
+HTTP/1.1 200 OK
+Server: openresty
+Content-Type: text/plain; charset=utf-8
+Transfer-Encoding: chunked
+Connection: keep-alive
+
+# HELP apisix_batch_process_entries batch process remaining entries
+# TYPE apisix_batch_process_entries gauge
+apisix_batch_process_entries{name="http logger",route_id="1",server_addr="172.19.0.8"} 0
+# HELP apisix_etcd_modify_indexes Etcd modify index for APISIX keys
+# TYPE apisix_etcd_modify_indexes gauge
+apisix_etcd_modify_indexes{key="consumers"} 17819
+apisix_etcd_modify_indexes{key="global_rules"} 17832
+apisix_etcd_modify_indexes{key="max_modify_index"} 20028
+apisix_etcd_modify_indexes{key="prev_index"} 18963
+apisix_etcd_modify_indexes{key="protos"} 0
+apisix_etcd_modify_indexes{key="routes"} 20028
+...
+```
+
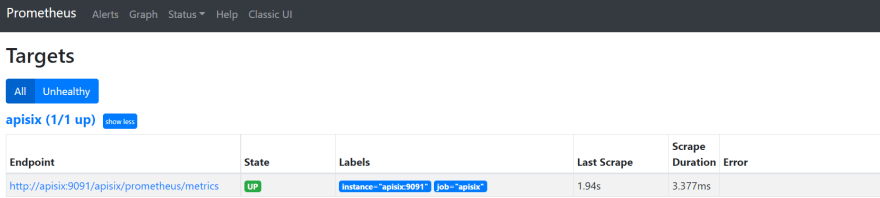
+你还可以通过 `http://localhost:9090/targets` 在 Prometheus 仪表板上查看端点的状态。
+
+
+
+如上图,APISIX 公开的指标端点已启动并正在运行。
+
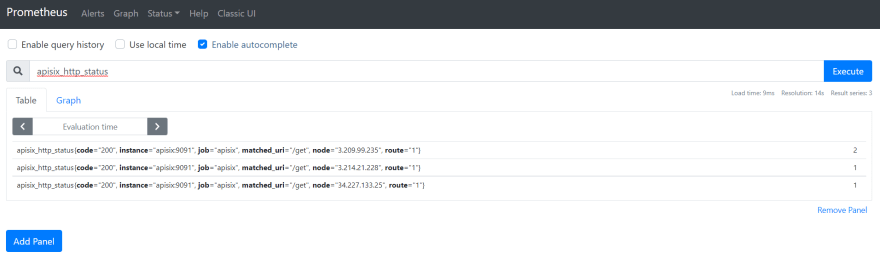
+现在,你可以查询 `apisix_http_status` 的指标,查看 APISIX 处理了哪些 HTTP 请求及其结果。
+
+
+
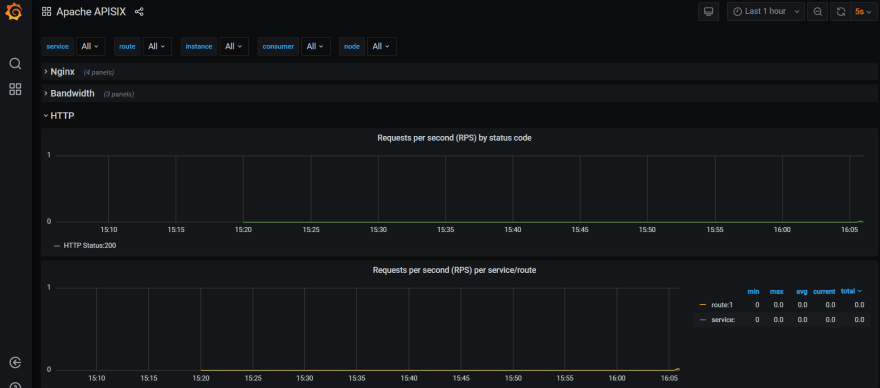
+除此之外,你还可以查看在本地实例中运行的 Grafana 仪表板。请访问 `http://localhost:3000/`。
+
+
+
+目前,APISIX 还提供了其他两个关于指标的插件:
+
+- [Node status 插件](../plugins/node-status.md)(https://apisix.apache.org/docs/apisix/plugins/node-status/)
+- [Datadog 插件](../plugins/datadog.md)
+
+## 链路追踪
+
+**链路追踪**就是将一次请求还原成调用链路,并将该请求的调用情况使用拓扑的方式展现,比如展示各个微服务节点上的耗时,请求具体经过了哪些服务器以及每个服务节点的请求状态等内容。
+
+[Zipkin](https://zipkin.io/) 一个开源的分布式追踪系统。 APISIX 的 [zipkin 插件](../plugins/zipkin.md) 支持根据 [Zipkin API 规范](https://zipkin.io/pages/instrumenting.html) 收集链路信息并报告给 Zipkin Collector。
+
+:::tip 提示
+
+使用该插件前,请确保你已经有一个正在运行的 Zipkin 实例。你可以使用 Docker 快速启动一个 Zipkin 实例:
+
+```
+docker run -d -p 9411:9411 openzipkin/zipkin
+```
+
+:::
+
+你可以通过如下示例,在指定路由中启用 `zipkin` 插件:
+
+```shell
+curl http://127.0.0.1:9180/apisix/admin/routes/1 \
+-H 'X-API-KEY: edd1c9f034335f136f87ad84b625c8f1' -X PUT -d '
+{
+ "methods": [
+ "GET"
+ ],
+ "uri": "/get",
+ "plugins": {
+ "zipkin": {
+ "endpoint": "http://127.0.0.1:9411/api/v2/spans",
+ "sample_ratio": 1
+ }
+ },
+ "upstream_id": "1"
+}'
+```
+
+你可以通过以下命令请求 APISIX:
+
+```shell
+curl -i http://127.0.0.1:9080/get
+```
+
+如下所示,返回结果中的 `header` 部分附加了一些额外的跟踪标识符(TraceId、SpanId 和 ParentId):
+
+```text
+"X-B3-Parentspanid": "61bd3f4046a800e7",
+"X-B3-Sampled": "1",
+"X-B3-Spanid": "855cd5465957f414",
+"X-B3-Traceid": "e18985df47dab632d62083fd96626692",
+```
+
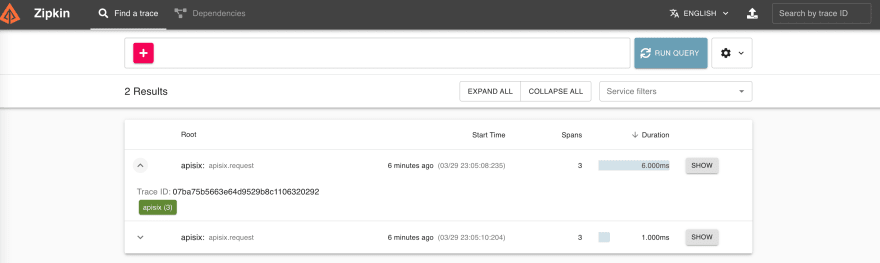
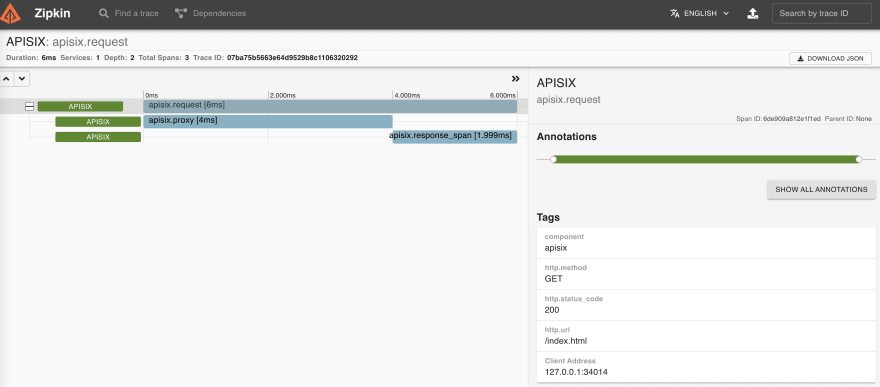
+你可以通过访问 `http://127.0.0.1:9411/zipkin`,在 Zinkin 的 Web UI 上看到请求链路。
+
+
+
+
+
+你也可以通过另外两个插件进行链路追踪:
+
+- [Skywalking 插件](../plugins/skywalking.md)
+
+- [OpenTelemetry 插件](../plugins/opentelemetry.md)
+
+## 总结
+
+API 可观测性是一种用于在 API 世界中管理应用程序的框架,APISIX 的插件可以通过集成到多个可观测性平台来帮助你监控 API,让你更专注于开发核心业务功能,无需为集成多个可观测性应用花费更多时间。
diff --git a/docs/zh/latest/tutorials/protect-api.md b/docs/zh/latest/tutorials/protect-api.md
new file mode 100644
index 000000000..6e259b7ae
--- /dev/null
+++ b/docs/zh/latest/tutorials/protect-api.md
@@ -0,0 +1,129 @@
+---
+title: 保护 API
+keywords:
+ - API 网关
+ - Apache APISIX
+ - 发布路由
+ - 创建服务
+description: 本文介绍了如何通过 Apache APISIX 发布服务和路由。
+---
+
+<!--
+#
+# Licensed to the Apache Software Foundation (ASF) under one or more
+# contributor license agreements. See the NOTICE file distributed with
+# this work for additional information regarding copyright ownership.
+# The ASF licenses this file to You under the Apache License, Version 2.0
+# (the "License"); you may not use this file except in compliance with
+# the License. You may obtain a copy of the License at
+#
+# http://www.apache.org/licenses/LICENSE-2.0
+#
+# Unless required by applicable law or agreed to in writing, software
+# distributed under the License is distributed on an "AS IS" BASIS,
+# WITHOUT WARRANTIES OR CONDITIONS OF ANY KIND, either express or implied.
+# See the License for the specific language governing permissions and
+# limitations under the License.
+#
+-->
+
+## 描述
+
+本文将为你介绍使用限流限速和安全插件保护你的 API。
+
+## 概念介绍
+
+### 插件
+
+[Plugin](./terminology/plugin.md) 也称之为插件,它是扩展 APISIX 应用层能力的关键机制,也是在使用 APISIX 时最常用的资源对象。插件主要是在 HTTP 请求或响应生命周期期间执行的、针对请求的个性化策略。插件可以与路由、服务或消费者绑定。
+
+:::note 注意
+
+如果 [路由](./terminology/route.md)、[服务](./terminology/service.md)、[插件配置](./terminology/plugin-config.md) 或消费者都绑定了相同的插件,则只有一份插件配置会生效,插件配置的优先级由高到低顺序是:消费者 > 路由 > 插件配置 > 服务。同时在插件执行过程中也会涉及 6 个阶段,分别是 `rewrite`、`access`、`before_proxy`、`header_filter`、`body_filter` 和 `log`。
+
+:::
+
+## 前提条件
+
+在进行该教程前,请确保你已经[公开服务](./expose-api.md)。
+
+## 保护 API
+
+在很多时候,我们的 API 并不是处于一个非常安全的状态,它随时会收到不正常的访问,一旦访问流量突增,可能就会导致你的 API 发生故障,产生不必要的损失。因此你可以通过速率限制保护你的 API 服务,限制非正常的访问请求,保障 API 服务的稳定运行。对此,我们可以使用如下方式进行:
+
+1. 限制请求速率;
+2. 限制单位时间内的请求数;
+3. 延迟请求;
+4. 拒绝客户端请求;
+5. 限制响应数据的速率。
+
+为了实现上述功能,APISIX 提供了多个限流限速的插件,包括 [limit-conn](./plugins/limit-conn.md)、[limit-count](./plugins/limit-count.md) 和 [limit-req](./plugins/limit-req.md)。
+
+- `limit-conn` 插件主要用于限制客户端对服务的并发请求数。
+- `limit-req` 插件使用漏桶算法限制对用户服务的请求速率。
+- `limit-count` 插件主要用于在指定的时间范围内,限制每个客户端总请求个数。
+
+接下来,我们将以 `limit-count` 插件为例,为你介绍如何通过限流限速插件保护你的 API。
+
+1. 创建路由。
+
+```shell
+curl -i http://127.0.0.1:9180/apisix/admin/routes/1 \
+-H 'X-API-KEY: edd1c9f034335f136f87ad84b625c8f1' -X PUT -d '
+{
+ "uri": "/index.html",
+ "plugins": {
+ "limit-count": {
+ "count": 2,
+ "time_window": 60,
+ "rejected_code": 503,
+ "key_type": "var",
+ "key": "remote_addr"
+ }
+ },
+ "upstream_id": "1"
+ }
+}'
+
+```
+
+以上配置中,使用了[公开服务](./expose-api.md)中创建的上游创建了一个 ID 为 `1` 的路由, ,并且启用了 `limit-count` 插件。该插件仅允许客户端在 60 秒内,访问上游服务 2 次,超过两次,则会返回 `503` 错误码。
+
+2. 测试插件。
+
+```shell
+
+curl http://127.0.0.1:9080/index.html
+
+```
+
+使用上述命令连续访问三次后,则会出现如下错误。
+
+```
+<html>
+<head><title>503 Service Temporarily Unavailable</title></head>
+<body>
+<center><h1>503 Service Temporarily Unavailable</h1></center>
+<hr><center>openresty</center>
+</body>
+</html>
+```
+
+返回上述结果,则表示 `limit-count` 插件已经配置成功。
+
+## 流量控制插件
+
+APISIX 除了提供限流限速的插件外,还提供了很多其他的关于 **traffic** 插件来满足实际场景的需求:
+
+- [proxy-cache](./plugins/proxy-cache.md):该插件提供缓存后端响应数据的能力,它可以和其他插件一起使用。该插件支持基于磁盘和内存的缓存。
+- [request-validation](./plugins/request-validation.md):该插件用于提前验证向上游服务转发的请求。
+- [proxy-mirror](./plugins/proxy-mirror.md):该插件提供了镜像客户端请求的能力。流量镜像是将线上真实流量拷贝到镜像服务中,以便在不影响线上服务的情况下,对线上流量或请求内容进行具体的分析。
+- [api-breaker](./plugins/api-breaker.md):该插件实现了 API 熔断功能,从而帮助我们保护上游业务服务。
+- [traffic-split](./plugins/traffic-split.md):该插件使用户可以逐步引导各个上游之间的流量百分比。,你可以使用该插件实现蓝绿发布,灰度发布。
+- [request-id](./plugins/request-id.md):该插件通过 APISIX 为每一个请求代理添加 `unique` ID 用于追踪 API 请求。
+- [proxy-control](./plugins/proxy-control.md):该插件能够动态地控制 NGINX 代理的相关行为。
+- [client-control](./plugins/client-control.md):该插件能够通过设置客户端请求体大小的上限来动态地控制 NGINX 处理客户端的请求。
+
+## 更多操作
+
+你可以参考[监控 API](./observe-your-api.md) 文档,对 APISIX 进行监控,日志采集,链路追踪等。