You are viewing a plain text version of this content. The canonical link for it is here.
Posted to notifications@skywalking.apache.org by GitBox <gi...@apache.org> on 2022/09/16 05:04:47 UTC

[GitHub] [skywalking] yswdqz opened a new pull request, #9614: Support monitoring MySQL slow sql

yswdqz opened a new pull request, #9614:
URL: https://github.com/apache/skywalking/pull/9614

   - [ ] If this is non-trivial feature, paste the links/URLs to the design doc.
   - [x] Update the documentation to include this new feature.
   - [x] Tests(including UT, IT, E2E) are added to verify the new feature.
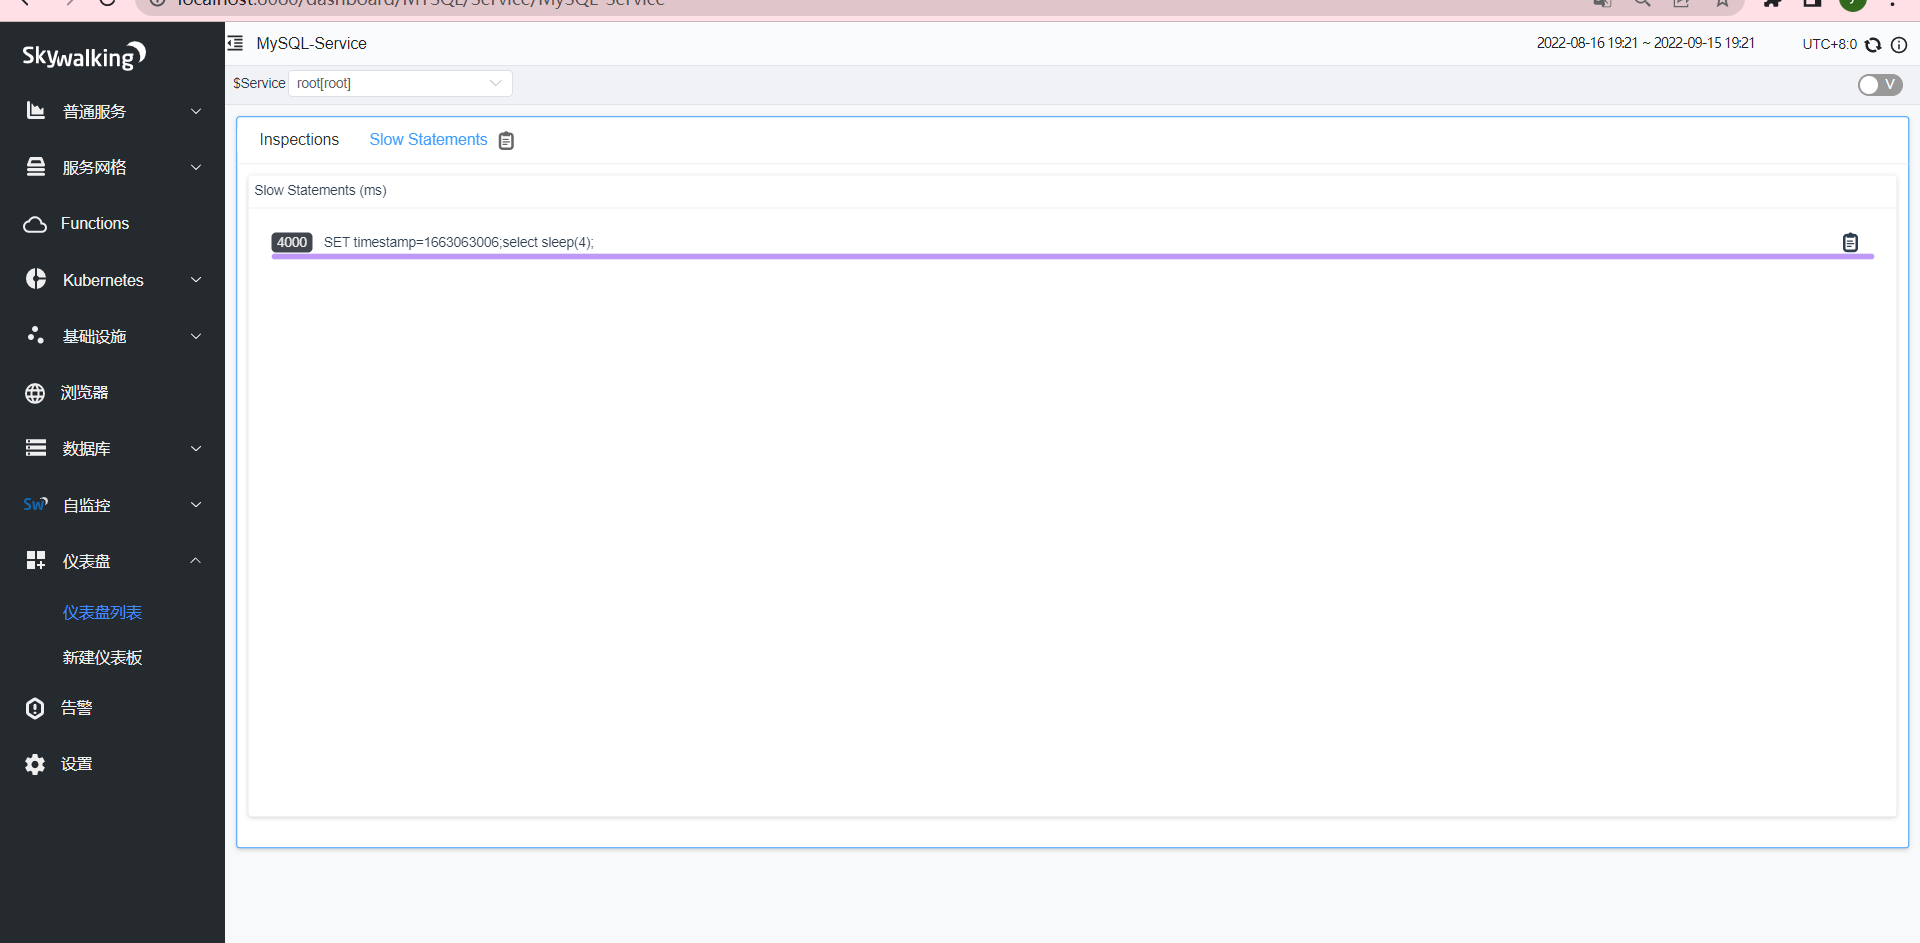
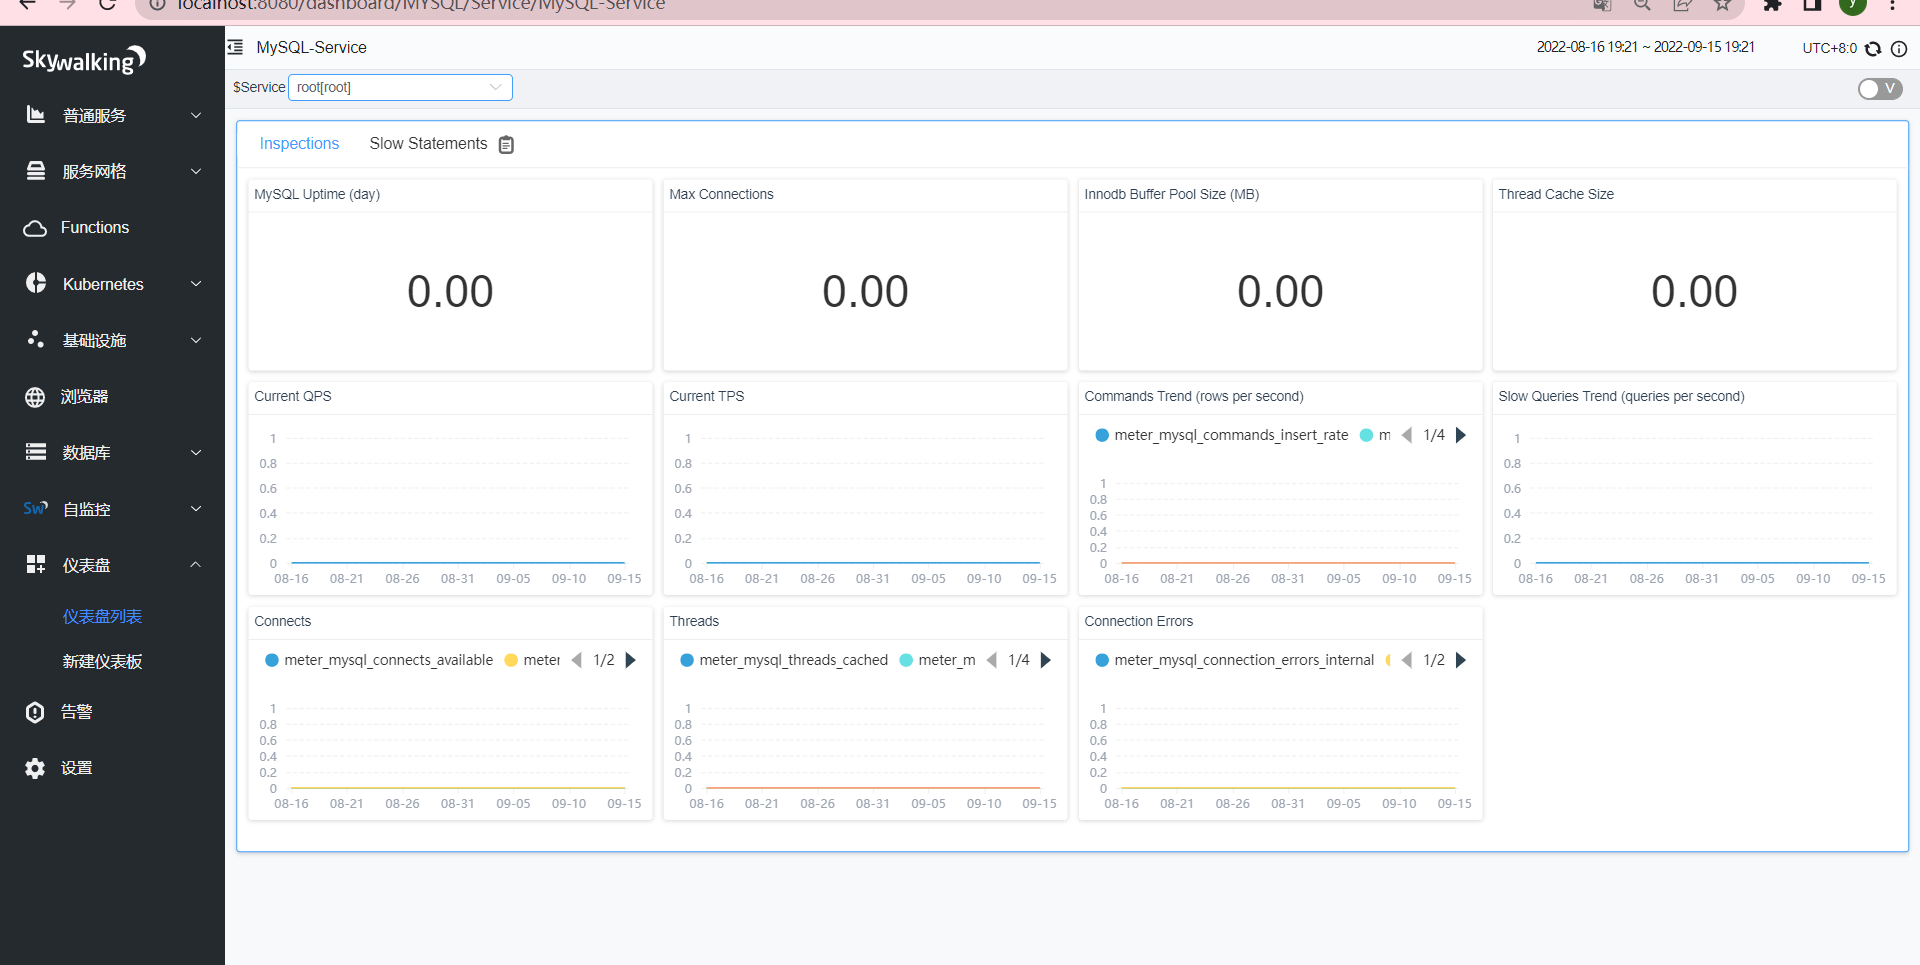
   - [x] If it's UI related, attach the screenshots below.
   
   - [x] If this pull request closes/resolves/fixes an existing issue, replace the issue number. Closes #9548 .
   - [x] Update the [`CHANGES` log](https://github.com/apache/skywalking/blob/master/docs/en/changes/changes.md).
   
   ![}~I7B9`V{NT3EFT%8{AFD Y](https://user-images.githubusercontent.com/74546965/190560553-f5626c91-56c4-4174-9e97-1c90c61746d6.png)
   ![12`~4{LO}~M US4)6DS0M(0](https://user-images.githubusercontent.com/74546965/190560563-191063eb-094d-4bd4-9a2b-305b87b7e95e.png)


-- 
This is an automated message from the Apache Git Service.
To respond to the message, please log on to GitHub and use the
URL above to go to the specific comment.

To unsubscribe, e-mail: notifications-unsubscribe@skywalking.apache.org

For queries about this service, please contact Infrastructure at:
users@infra.apache.org


[GitHub] [skywalking] yswdqz commented on a diff in pull request #9614: Support monitoring MySQL slow sql

Posted by GitBox <gi...@apache.org>.
yswdqz commented on code in PR #9614:
URL: https://github.com/apache/skywalking/pull/9614#discussion_r972625923


##########
oap-server/server-starter/src/main/resources/ui-initialized-templates/mysql/mysql-service.json:
##########
@@ -17,317 +17,345 @@
 
 [
    {
-      "id":"2981ef0e-1552-4cf0-a68c-da023b4a0fd8",
+      "id":"2ca19857-dcdb-491a-9739-d7ab79beb60b",
       "configuration":{
          "children":[
             {
                "x":0,
                "y":0,
-               "w":6,
-               "h":11,
+               "w":24,
+               "h":33,
                "i":"0",
-               "type":"Widget",
-               "metricTypes":[
-                  "readMetricsValue"
-               ],
-               "metrics":[
-                  "meter_mysql_uptime"
-               ],
-               "graph":{
-                  "type":"Card",
-                  "fontSize":40,
-                  "textAlign":"center",
-                  "showUnit":true
-               },
-               "metricConfig":[
+               "type":"Tab",
+               "children":[
                   {
-                     "calculation":"secondToDay"
-                  }
-               ],
-               "widget":{
-                  "title":"MySQL Uptime (day)"
-               }
-            },
-            {
-               "x":0,
-               "y":11,
-               "w":6,
-               "h":14,
-               "i":"1",
-               "type":"Widget",
-               "metricTypes":[
-                  "readMetricsValues"
-               ],
-               "metrics":[
-                  "meter_mysql_qps"
-               ],
-               "graph":{
-                  "type":"Line",
-                  "step":false,
-                  "smooth":false,
-                  "showSymbol":false,
-                  "showXAxis":true,
-                  "showYAxis":true
-               },
-               "widget":{
-                  "title":"Current QPS"
-               },
-               "value":"1",
-               "label":"1"
-            },
-            {
-               "x":12,
-               "y":0,
-               "w":6,
-               "h":11,
-               "i":"2",
-               "type":"Widget",
-               "metricTypes":[
-                  "readMetricsValue"
-               ],
-               "metrics":[
-                  "meter_mysql_innodb_buffer_pool_size"
-               ],
-               "graph":{
-                  "type":"Card",
-                  "fontSize":40,
-                  "textAlign":"center",
-                  "showUnit":true
-               },
-               "metricConfig":[
+                     "name":"Inspections",
+                     "children":[
+                        {
+                           "x":0,
+                           "y":0,
+                           "w":6,
+                           "h":9,
+                           "i":"0",
+                           "type":"Widget",
+                           "metricTypes":[
+                              "readMetricsValue"
+                           ],
+                           "metrics":[
+                              "meter_mysql_uptime"
+                           ],
+                           "graph":{
+                              "type":"Card",
+                              "fontSize":40,
+                              "textAlign":"center",
+                              "showUnit":true
+                           },
+                           "metricConfig":[
+                              {
+                                 "calculation":"secondToDay"
+                              }
+                           ],
+                           "widget":{
+                              "title":"MySQL Uptime (day)"
+                           }
+                        },
+                        {
+                           "x":0,
+                           "y":9,
+                           "w":6,
+                           "h":10,
+                           "i":"1",
+                           "type":"Widget",
+                           "metricTypes":[
+                              "readMetricsValues"
+                           ],
+                           "metrics":[
+                              "meter_mysql_qps"
+                           ],
+                           "graph":{
+                              "type":"Line",
+                              "step":false,
+                              "smooth":false,
+                              "showSymbol":false,
+                              "showXAxis":true,
+                              "showYAxis":true
+                           },
+                           "widget":{
+                              "title":"Current QPS"
+                           }
+                        },
+                        {
+                           "x":12,
+                           "y":0,
+                           "w":6,
+                           "h":9,
+                           "i":"2",
+                           "type":"Widget",
+                           "metricTypes":[
+                              "readMetricsValue"
+                           ],
+                           "metrics":[
+                              "meter_mysql_innodb_buffer_pool_size"
+                           ],
+                           "graph":{
+                              "type":"Card",
+                              "fontSize":40,
+                              "textAlign":"center",
+                              "showUnit":true
+                           },
+                           "metricConfig":[
+                              {
+                                 "calculation":"byteToMB"
+                              }
+                           ],
+                           "widget":{
+                              "title":"Innodb Buffer Pool Size (MB)"
+                           }
+                        },
+                        {
+                           "x":6,
+                           "y":0,
+                           "w":6,
+                           "h":9,
+                           "i":"3",
+                           "type":"Widget",
+                           "metricTypes":[
+                              "readMetricsValue"
+                           ],
+                           "metrics":[
+                              "meter_mysql_max_connections"
+                           ],
+                           "graph":{
+                              "type":"Card",
+                              "fontSize":40,
+                              "textAlign":"center",
+                              "showUnit":true
+                           },
+                           "widget":{
+                              "title":"Max Connections"
+                           }
+                        },
+                        {
+                           "x":18,
+                           "y":0,
+                           "w":6,
+                           "h":9,
+                           "i":"4",
+                           "type":"Widget",
+                           "metricTypes":[
+                              "readMetricsValue"
+                           ],
+                           "metrics":[
+                              "meter_mysql_thread_cache_size"
+                           ],
+                           "graph":{
+                              "type":"Card",
+                              "fontSize":40,
+                              "textAlign":"center",
+                              "showUnit":true
+                           },
+                           "widget":{
+                              "title":"Thread Cache Size"
+                           }
+                        },
+                        {
+                           "x":6,
+                           "y":9,
+                           "w":6,
+                           "h":10,
+                           "i":"5",
+                           "type":"Widget",
+                           "metricTypes":[
+                              "readMetricsValues"
+                           ],
+                           "metrics":[
+                              "meter_mysql_tps"
+                           ],
+                           "graph":{
+                              "type":"Line",
+                              "step":false,
+                              "smooth":false,
+                              "showSymbol":false,
+                              "showXAxis":true,
+                              "showYAxis":true
+                           },
+                           "widget":{
+                              "title":"Current TPS"
+                           }
+                        },
+                        {
+                           "x":12,
+                           "y":9,
+                           "w":6,
+                           "h":10,
+                           "i":"6",
+                           "type":"Widget",
+                           "metricTypes":[
+                              "readMetricsValues",
+                              "readMetricsValues"
+                           ],
+                           "metrics":[
+                              "meter_mysql_commands_insert_rate",
+                              "meter_mysql_commands_select_rate",
+                              "meter_mysql_commands_delete_rate",
+                              "meter_mysql_commands_update_rate"
+                           ],
+                           "graph":{
+                              "type":"Area",
+                              "opacity":0.4,
+                              "showXAxis":true,
+                              "showYAxis":true
+                           },
+                           "widget":{
+                              "title":"Commands Trend (rows per second)"
+                           }
+                        },
+                        {
+                           "x":6,
+                           "y":19,
+                           "w":6,
+                           "h":10,
+                           "i":"7",
+                           "type":"Widget",
+                           "metricTypes":[
+                              "readMetricsValues",
+                              "readMetricsValues"
+                           ],
+                           "metrics":[
+                              "meter_mysql_threads_cached",
+                              "meter_mysql_threads_running",
+                              "meter_mysql_threads_created",
+                              "meter_mysql_threads_connected"
+                           ],
+                           "graph":{
+                              "type":"Area",
+                              "opacity":0.4,
+                              "showXAxis":true,
+                              "showYAxis":true
+                           },
+                           "widget":{
+                              "title":"Threads"
+                           }
+                        },
+                        {
+                           "x":0,
+                           "y":19,
+                           "w":6,
+                           "h":10,
+                           "i":"8",
+                           "type":"Widget",
+                           "metricTypes":[
+                              "readMetricsValues",
+                              "readMetricsValues"
+                           ],
+                           "metrics":[
+                              "meter_mysql_connects_available",
+                              "meter_mysql_connects_aborted"
+                           ],
+                           "graph":{
+                              "type":"Line",
+                              "step":false,
+                              "smooth":false,
+                              "showSymbol":false,
+                              "showXAxis":true,
+                              "showYAxis":true
+                           },
+                           "widget":{
+                              "title":"Connects"
+                           }
+                        },
+                        {
+                           "x":18,
+                           "y":9,
+                           "w":6,
+                           "h":10,
+                           "i":"10",
+                           "type":"Widget",
+                           "metricTypes":[
+                              "readMetricsValues"
+                           ],
+                           "metrics":[
+                              "meter_mysql_slow_queries_rate"
+                           ],
+                           "graph":{
+                              "type":"Line",
+                              "step":false,
+                              "smooth":false,
+                              "showSymbol":false,
+                              "showXAxis":true,
+                              "showYAxis":true
+                           },
+                           "widget":{
+                              "title":"Slow Queries Trend (queries per second)"
+                           }
+                        },
+                        {
+                           "x":12,
+                           "y":19,
+                           "w":6,
+                           "h":10,
+                           "i":"11",
+                           "type":"Widget",
+                           "metricTypes":[
+                              "readMetricsValues",
+                              "readMetricsValues"
+                           ],
+                           "metrics":[
+                              "meter_mysql_connection_errors_internal",
+                              "meter_mysql_connection_errors_max_connections"
+                           ],
+                           "graph":{
+                              "type":"Line",
+                              "step":false,
+                              "smooth":false,
+                              "showSymbol":false,
+                              "showXAxis":true,
+                              "showYAxis":true
+                           },
+                           "widget":{
+                              "title":"Connection Errors"
+                           }
+                        }
+                     ]
+                  },
                   {
-                     "calculation":"byteToMB"
+                     "name":"Slow Statements",
+                     "children":[
+                        {
+                           "x":0,
+                           "y":0,
+                           "w":24,
+                           "h":29,
+                           "i":"0",
+                           "type":"Widget",
+                           "metricTypes":[
+                              "readSampledRecords"
+                           ],
+                           "metrics":[
+                              "top_n_database_statement"

Review Comment:
   > Do we support to set N for sampled record on UI? As you use a whole page to show. Top 50 seems better.
   
   We support that, and default is 10.
   > As you use a whole page to show. Top 50 seems better.
   I get it.


##########
oap-server/server-starter/src/main/resources/ui-initialized-templates/mysql/mysql-service.json:
##########
@@ -17,317 +17,345 @@
 
 [
    {
-      "id":"2981ef0e-1552-4cf0-a68c-da023b4a0fd8",
+      "id":"2ca19857-dcdb-491a-9739-d7ab79beb60b",
       "configuration":{
          "children":[
             {
                "x":0,
                "y":0,
-               "w":6,
-               "h":11,
+               "w":24,
+               "h":33,
                "i":"0",
-               "type":"Widget",
-               "metricTypes":[
-                  "readMetricsValue"
-               ],
-               "metrics":[
-                  "meter_mysql_uptime"
-               ],
-               "graph":{
-                  "type":"Card",
-                  "fontSize":40,
-                  "textAlign":"center",
-                  "showUnit":true
-               },
-               "metricConfig":[
+               "type":"Tab",
+               "children":[
                   {
-                     "calculation":"secondToDay"
-                  }
-               ],
-               "widget":{
-                  "title":"MySQL Uptime (day)"
-               }
-            },
-            {
-               "x":0,
-               "y":11,
-               "w":6,
-               "h":14,
-               "i":"1",
-               "type":"Widget",
-               "metricTypes":[
-                  "readMetricsValues"
-               ],
-               "metrics":[
-                  "meter_mysql_qps"
-               ],
-               "graph":{
-                  "type":"Line",
-                  "step":false,
-                  "smooth":false,
-                  "showSymbol":false,
-                  "showXAxis":true,
-                  "showYAxis":true
-               },
-               "widget":{
-                  "title":"Current QPS"
-               },
-               "value":"1",
-               "label":"1"
-            },
-            {
-               "x":12,
-               "y":0,
-               "w":6,
-               "h":11,
-               "i":"2",
-               "type":"Widget",
-               "metricTypes":[
-                  "readMetricsValue"
-               ],
-               "metrics":[
-                  "meter_mysql_innodb_buffer_pool_size"
-               ],
-               "graph":{
-                  "type":"Card",
-                  "fontSize":40,
-                  "textAlign":"center",
-                  "showUnit":true
-               },
-               "metricConfig":[
+                     "name":"Inspections",
+                     "children":[
+                        {
+                           "x":0,
+                           "y":0,
+                           "w":6,
+                           "h":9,
+                           "i":"0",
+                           "type":"Widget",
+                           "metricTypes":[
+                              "readMetricsValue"
+                           ],
+                           "metrics":[
+                              "meter_mysql_uptime"
+                           ],
+                           "graph":{
+                              "type":"Card",
+                              "fontSize":40,
+                              "textAlign":"center",
+                              "showUnit":true
+                           },
+                           "metricConfig":[
+                              {
+                                 "calculation":"secondToDay"
+                              }
+                           ],
+                           "widget":{
+                              "title":"MySQL Uptime (day)"
+                           }
+                        },
+                        {
+                           "x":0,
+                           "y":9,
+                           "w":6,
+                           "h":10,
+                           "i":"1",
+                           "type":"Widget",
+                           "metricTypes":[
+                              "readMetricsValues"
+                           ],
+                           "metrics":[
+                              "meter_mysql_qps"
+                           ],
+                           "graph":{
+                              "type":"Line",
+                              "step":false,
+                              "smooth":false,
+                              "showSymbol":false,
+                              "showXAxis":true,
+                              "showYAxis":true
+                           },
+                           "widget":{
+                              "title":"Current QPS"
+                           }
+                        },
+                        {
+                           "x":12,
+                           "y":0,
+                           "w":6,
+                           "h":9,
+                           "i":"2",
+                           "type":"Widget",
+                           "metricTypes":[
+                              "readMetricsValue"
+                           ],
+                           "metrics":[
+                              "meter_mysql_innodb_buffer_pool_size"
+                           ],
+                           "graph":{
+                              "type":"Card",
+                              "fontSize":40,
+                              "textAlign":"center",
+                              "showUnit":true
+                           },
+                           "metricConfig":[
+                              {
+                                 "calculation":"byteToMB"
+                              }
+                           ],
+                           "widget":{
+                              "title":"Innodb Buffer Pool Size (MB)"
+                           }
+                        },
+                        {
+                           "x":6,
+                           "y":0,
+                           "w":6,
+                           "h":9,
+                           "i":"3",
+                           "type":"Widget",
+                           "metricTypes":[
+                              "readMetricsValue"
+                           ],
+                           "metrics":[
+                              "meter_mysql_max_connections"
+                           ],
+                           "graph":{
+                              "type":"Card",
+                              "fontSize":40,
+                              "textAlign":"center",
+                              "showUnit":true
+                           },
+                           "widget":{
+                              "title":"Max Connections"
+                           }
+                        },
+                        {
+                           "x":18,
+                           "y":0,
+                           "w":6,
+                           "h":9,
+                           "i":"4",
+                           "type":"Widget",
+                           "metricTypes":[
+                              "readMetricsValue"
+                           ],
+                           "metrics":[
+                              "meter_mysql_thread_cache_size"
+                           ],
+                           "graph":{
+                              "type":"Card",
+                              "fontSize":40,
+                              "textAlign":"center",
+                              "showUnit":true
+                           },
+                           "widget":{
+                              "title":"Thread Cache Size"
+                           }
+                        },
+                        {
+                           "x":6,
+                           "y":9,
+                           "w":6,
+                           "h":10,
+                           "i":"5",
+                           "type":"Widget",
+                           "metricTypes":[
+                              "readMetricsValues"
+                           ],
+                           "metrics":[
+                              "meter_mysql_tps"
+                           ],
+                           "graph":{
+                              "type":"Line",
+                              "step":false,
+                              "smooth":false,
+                              "showSymbol":false,
+                              "showXAxis":true,
+                              "showYAxis":true
+                           },
+                           "widget":{
+                              "title":"Current TPS"
+                           }
+                        },
+                        {
+                           "x":12,
+                           "y":9,
+                           "w":6,
+                           "h":10,
+                           "i":"6",
+                           "type":"Widget",
+                           "metricTypes":[
+                              "readMetricsValues",
+                              "readMetricsValues"
+                           ],
+                           "metrics":[
+                              "meter_mysql_commands_insert_rate",
+                              "meter_mysql_commands_select_rate",
+                              "meter_mysql_commands_delete_rate",
+                              "meter_mysql_commands_update_rate"
+                           ],
+                           "graph":{
+                              "type":"Area",
+                              "opacity":0.4,
+                              "showXAxis":true,
+                              "showYAxis":true
+                           },
+                           "widget":{
+                              "title":"Commands Trend (rows per second)"
+                           }
+                        },
+                        {
+                           "x":6,
+                           "y":19,
+                           "w":6,
+                           "h":10,
+                           "i":"7",
+                           "type":"Widget",
+                           "metricTypes":[
+                              "readMetricsValues",
+                              "readMetricsValues"
+                           ],
+                           "metrics":[
+                              "meter_mysql_threads_cached",
+                              "meter_mysql_threads_running",
+                              "meter_mysql_threads_created",
+                              "meter_mysql_threads_connected"
+                           ],
+                           "graph":{
+                              "type":"Area",
+                              "opacity":0.4,
+                              "showXAxis":true,
+                              "showYAxis":true
+                           },
+                           "widget":{
+                              "title":"Threads"
+                           }
+                        },
+                        {
+                           "x":0,
+                           "y":19,
+                           "w":6,
+                           "h":10,
+                           "i":"8",
+                           "type":"Widget",
+                           "metricTypes":[
+                              "readMetricsValues",
+                              "readMetricsValues"
+                           ],
+                           "metrics":[
+                              "meter_mysql_connects_available",
+                              "meter_mysql_connects_aborted"
+                           ],
+                           "graph":{
+                              "type":"Line",
+                              "step":false,
+                              "smooth":false,
+                              "showSymbol":false,
+                              "showXAxis":true,
+                              "showYAxis":true
+                           },
+                           "widget":{
+                              "title":"Connects"
+                           }
+                        },
+                        {
+                           "x":18,
+                           "y":9,
+                           "w":6,
+                           "h":10,
+                           "i":"10",
+                           "type":"Widget",
+                           "metricTypes":[
+                              "readMetricsValues"
+                           ],
+                           "metrics":[
+                              "meter_mysql_slow_queries_rate"
+                           ],
+                           "graph":{
+                              "type":"Line",
+                              "step":false,
+                              "smooth":false,
+                              "showSymbol":false,
+                              "showXAxis":true,
+                              "showYAxis":true
+                           },
+                           "widget":{
+                              "title":"Slow Queries Trend (queries per second)"
+                           }
+                        },
+                        {
+                           "x":12,
+                           "y":19,
+                           "w":6,
+                           "h":10,
+                           "i":"11",
+                           "type":"Widget",
+                           "metricTypes":[
+                              "readMetricsValues",
+                              "readMetricsValues"
+                           ],
+                           "metrics":[
+                              "meter_mysql_connection_errors_internal",
+                              "meter_mysql_connection_errors_max_connections"
+                           ],
+                           "graph":{
+                              "type":"Line",
+                              "step":false,
+                              "smooth":false,
+                              "showSymbol":false,
+                              "showXAxis":true,
+                              "showYAxis":true
+                           },
+                           "widget":{
+                              "title":"Connection Errors"
+                           }
+                        }
+                     ]
+                  },
                   {
-                     "calculation":"byteToMB"
+                     "name":"Slow Statements",
+                     "children":[
+                        {
+                           "x":0,
+                           "y":0,
+                           "w":24,
+                           "h":29,
+                           "i":"0",
+                           "type":"Widget",
+                           "metricTypes":[
+                              "readSampledRecords"
+                           ],
+                           "metrics":[
+                              "top_n_database_statement"

Review Comment:
   > Do we support to set N for sampled record on UI? As you use a whole page to show. Top 50 seems better.
   
   We support that, and default is 10.
   > As you use a whole page to show. Top 50 seems better.
   
   I get it.


-- 
This is an automated message from the Apache Git Service.
To respond to the message, please log on to GitHub and use the
URL above to go to the specific comment.

To unsubscribe, e-mail: notifications-unsubscribe@skywalking.apache.org

For queries about this service, please contact Infrastructure at:
users@infra.apache.org


[GitHub] [skywalking] yswdqz commented on pull request #9614: Support monitoring MySQL slow sql

Posted by GitBox <gi...@apache.org>.
yswdqz commented on PR #9614:
URL: https://github.com/apache/skywalking/pull/9614#issuecomment-1249039834

   Just like this?


-- 
This is an automated message from the Apache Git Service.
To respond to the message, please log on to GitHub and use the
URL above to go to the specific comment.

To unsubscribe, e-mail: notifications-unsubscribe@skywalking.apache.org

For queries about this service, please contact Infrastructure at:
users@infra.apache.org


[GitHub] [skywalking] wu-sheng merged pull request #9614: Support monitoring MySQL slow sql

Posted by GitBox <gi...@apache.org>.
wu-sheng merged PR #9614:
URL: https://github.com/apache/skywalking/pull/9614


-- 
This is an automated message from the Apache Git Service.
To respond to the message, please log on to GitHub and use the
URL above to go to the specific comment.

To unsubscribe, e-mail: notifications-unsubscribe@skywalking.apache.org

For queries about this service, please contact Infrastructure at:
users@infra.apache.org


[GitHub] [skywalking] wu-sheng commented on a diff in pull request #9614: Support monitoring MySQL slow sql

Posted by GitBox <gi...@apache.org>.
wu-sheng commented on code in PR #9614:
URL: https://github.com/apache/skywalking/pull/9614#discussion_r972620234


##########
oap-server/server-starter/src/main/resources/ui-initialized-templates/mysql/mysql-service.json:
##########
@@ -17,317 +17,345 @@
 
 [
    {
-      "id":"2981ef0e-1552-4cf0-a68c-da023b4a0fd8",
+      "id":"2ca19857-dcdb-491a-9739-d7ab79beb60b",
       "configuration":{
          "children":[
             {
                "x":0,
                "y":0,
-               "w":6,
-               "h":11,
+               "w":24,
+               "h":33,
                "i":"0",
-               "type":"Widget",
-               "metricTypes":[
-                  "readMetricsValue"
-               ],
-               "metrics":[
-                  "meter_mysql_uptime"
-               ],
-               "graph":{
-                  "type":"Card",
-                  "fontSize":40,
-                  "textAlign":"center",
-                  "showUnit":true
-               },
-               "metricConfig":[
+               "type":"Tab",
+               "children":[
                   {
-                     "calculation":"secondToDay"
-                  }
-               ],
-               "widget":{
-                  "title":"MySQL Uptime (day)"
-               }
-            },
-            {
-               "x":0,
-               "y":11,
-               "w":6,
-               "h":14,
-               "i":"1",
-               "type":"Widget",
-               "metricTypes":[
-                  "readMetricsValues"
-               ],
-               "metrics":[
-                  "meter_mysql_qps"
-               ],
-               "graph":{
-                  "type":"Line",
-                  "step":false,
-                  "smooth":false,
-                  "showSymbol":false,
-                  "showXAxis":true,
-                  "showYAxis":true
-               },
-               "widget":{
-                  "title":"Current QPS"
-               },
-               "value":"1",
-               "label":"1"
-            },
-            {
-               "x":12,
-               "y":0,
-               "w":6,
-               "h":11,
-               "i":"2",
-               "type":"Widget",
-               "metricTypes":[
-                  "readMetricsValue"
-               ],
-               "metrics":[
-                  "meter_mysql_innodb_buffer_pool_size"
-               ],
-               "graph":{
-                  "type":"Card",
-                  "fontSize":40,
-                  "textAlign":"center",
-                  "showUnit":true
-               },
-               "metricConfig":[
+                     "name":"Inspections",
+                     "children":[
+                        {
+                           "x":0,
+                           "y":0,
+                           "w":6,
+                           "h":9,
+                           "i":"0",
+                           "type":"Widget",
+                           "metricTypes":[
+                              "readMetricsValue"
+                           ],
+                           "metrics":[
+                              "meter_mysql_uptime"
+                           ],
+                           "graph":{
+                              "type":"Card",
+                              "fontSize":40,
+                              "textAlign":"center",
+                              "showUnit":true
+                           },
+                           "metricConfig":[
+                              {
+                                 "calculation":"secondToDay"
+                              }
+                           ],
+                           "widget":{
+                              "title":"MySQL Uptime (day)"
+                           }
+                        },
+                        {
+                           "x":0,
+                           "y":9,
+                           "w":6,
+                           "h":10,
+                           "i":"1",
+                           "type":"Widget",
+                           "metricTypes":[
+                              "readMetricsValues"
+                           ],
+                           "metrics":[
+                              "meter_mysql_qps"
+                           ],
+                           "graph":{
+                              "type":"Line",
+                              "step":false,
+                              "smooth":false,
+                              "showSymbol":false,
+                              "showXAxis":true,
+                              "showYAxis":true
+                           },
+                           "widget":{
+                              "title":"Current QPS"
+                           }
+                        },
+                        {
+                           "x":12,
+                           "y":0,
+                           "w":6,
+                           "h":9,
+                           "i":"2",
+                           "type":"Widget",
+                           "metricTypes":[
+                              "readMetricsValue"
+                           ],
+                           "metrics":[
+                              "meter_mysql_innodb_buffer_pool_size"
+                           ],
+                           "graph":{
+                              "type":"Card",
+                              "fontSize":40,
+                              "textAlign":"center",
+                              "showUnit":true
+                           },
+                           "metricConfig":[
+                              {
+                                 "calculation":"byteToMB"
+                              }
+                           ],
+                           "widget":{
+                              "title":"Innodb Buffer Pool Size (MB)"
+                           }
+                        },
+                        {
+                           "x":6,
+                           "y":0,
+                           "w":6,
+                           "h":9,
+                           "i":"3",
+                           "type":"Widget",
+                           "metricTypes":[
+                              "readMetricsValue"
+                           ],
+                           "metrics":[
+                              "meter_mysql_max_connections"
+                           ],
+                           "graph":{
+                              "type":"Card",
+                              "fontSize":40,
+                              "textAlign":"center",
+                              "showUnit":true
+                           },
+                           "widget":{
+                              "title":"Max Connections"
+                           }
+                        },
+                        {
+                           "x":18,
+                           "y":0,
+                           "w":6,
+                           "h":9,
+                           "i":"4",
+                           "type":"Widget",
+                           "metricTypes":[
+                              "readMetricsValue"
+                           ],
+                           "metrics":[
+                              "meter_mysql_thread_cache_size"
+                           ],
+                           "graph":{
+                              "type":"Card",
+                              "fontSize":40,
+                              "textAlign":"center",
+                              "showUnit":true
+                           },
+                           "widget":{
+                              "title":"Thread Cache Size"
+                           }
+                        },
+                        {
+                           "x":6,
+                           "y":9,
+                           "w":6,
+                           "h":10,
+                           "i":"5",
+                           "type":"Widget",
+                           "metricTypes":[
+                              "readMetricsValues"
+                           ],
+                           "metrics":[
+                              "meter_mysql_tps"
+                           ],
+                           "graph":{
+                              "type":"Line",
+                              "step":false,
+                              "smooth":false,
+                              "showSymbol":false,
+                              "showXAxis":true,
+                              "showYAxis":true
+                           },
+                           "widget":{
+                              "title":"Current TPS"
+                           }
+                        },
+                        {
+                           "x":12,
+                           "y":9,
+                           "w":6,
+                           "h":10,
+                           "i":"6",
+                           "type":"Widget",
+                           "metricTypes":[
+                              "readMetricsValues",
+                              "readMetricsValues"
+                           ],
+                           "metrics":[
+                              "meter_mysql_commands_insert_rate",
+                              "meter_mysql_commands_select_rate",
+                              "meter_mysql_commands_delete_rate",
+                              "meter_mysql_commands_update_rate"
+                           ],
+                           "graph":{
+                              "type":"Area",
+                              "opacity":0.4,
+                              "showXAxis":true,
+                              "showYAxis":true
+                           },
+                           "widget":{
+                              "title":"Commands Trend (rows per second)"
+                           }
+                        },
+                        {
+                           "x":6,
+                           "y":19,
+                           "w":6,
+                           "h":10,
+                           "i":"7",
+                           "type":"Widget",
+                           "metricTypes":[
+                              "readMetricsValues",
+                              "readMetricsValues"
+                           ],
+                           "metrics":[
+                              "meter_mysql_threads_cached",
+                              "meter_mysql_threads_running",
+                              "meter_mysql_threads_created",
+                              "meter_mysql_threads_connected"
+                           ],
+                           "graph":{
+                              "type":"Area",
+                              "opacity":0.4,
+                              "showXAxis":true,
+                              "showYAxis":true
+                           },
+                           "widget":{
+                              "title":"Threads"
+                           }
+                        },
+                        {
+                           "x":0,
+                           "y":19,
+                           "w":6,
+                           "h":10,
+                           "i":"8",
+                           "type":"Widget",
+                           "metricTypes":[
+                              "readMetricsValues",
+                              "readMetricsValues"
+                           ],
+                           "metrics":[
+                              "meter_mysql_connects_available",
+                              "meter_mysql_connects_aborted"
+                           ],
+                           "graph":{
+                              "type":"Line",
+                              "step":false,
+                              "smooth":false,
+                              "showSymbol":false,
+                              "showXAxis":true,
+                              "showYAxis":true
+                           },
+                           "widget":{
+                              "title":"Connects"
+                           }
+                        },
+                        {
+                           "x":18,
+                           "y":9,
+                           "w":6,
+                           "h":10,
+                           "i":"10",
+                           "type":"Widget",
+                           "metricTypes":[
+                              "readMetricsValues"
+                           ],
+                           "metrics":[
+                              "meter_mysql_slow_queries_rate"
+                           ],
+                           "graph":{
+                              "type":"Line",
+                              "step":false,
+                              "smooth":false,
+                              "showSymbol":false,
+                              "showXAxis":true,
+                              "showYAxis":true
+                           },
+                           "widget":{
+                              "title":"Slow Queries Trend (queries per second)"
+                           }
+                        },
+                        {
+                           "x":12,
+                           "y":19,
+                           "w":6,
+                           "h":10,
+                           "i":"11",
+                           "type":"Widget",
+                           "metricTypes":[
+                              "readMetricsValues",
+                              "readMetricsValues"
+                           ],
+                           "metrics":[
+                              "meter_mysql_connection_errors_internal",
+                              "meter_mysql_connection_errors_max_connections"
+                           ],
+                           "graph":{
+                              "type":"Line",
+                              "step":false,
+                              "smooth":false,
+                              "showSymbol":false,
+                              "showXAxis":true,
+                              "showYAxis":true
+                           },
+                           "widget":{
+                              "title":"Connection Errors"
+                           }
+                        }
+                     ]
+                  },
                   {
-                     "calculation":"byteToMB"
+                     "name":"Slow Statements",
+                     "children":[
+                        {
+                           "x":0,
+                           "y":0,
+                           "w":24,
+                           "h":29,
+                           "i":"0",
+                           "type":"Widget",
+                           "metricTypes":[
+                              "readSampledRecords"
+                           ],
+                           "metrics":[
+                              "top_n_database_statement"

Review Comment:
   Do we support to set N for sampled record on UI?
   As you use a whole page to show. Top 50 seems better.


-- 
This is an automated message from the Apache Git Service.
To respond to the message, please log on to GitHub and use the
URL above to go to the specific comment.

To unsubscribe, e-mail: notifications-unsubscribe@skywalking.apache.org

For queries about this service, please contact Infrastructure at:
users@infra.apache.org


[GitHub] [skywalking] wu-sheng commented on pull request #9614: Support monitoring MySQL slow sql

Posted by GitBox <gi...@apache.org>.
wu-sheng commented on PR #9614:
URL: https://github.com/apache/skywalking/pull/9614#issuecomment-1249136434

   I reworded the docs to make things more clear. In the docs, we should use colloquial sentences, instead, formal words are better.


-- 
This is an automated message from the Apache Git Service.
To respond to the message, please log on to GitHub and use the
URL above to go to the specific comment.

To unsubscribe, e-mail: notifications-unsubscribe@skywalking.apache.org

For queries about this service, please contact Infrastructure at:
users@infra.apache.org


[GitHub] [skywalking] wu-sheng commented on a diff in pull request #9614: Support monitoring MySQL slow sql

Posted by GitBox <gi...@apache.org>.
wu-sheng commented on code in PR #9614:
URL: https://github.com/apache/skywalking/pull/9614#discussion_r972634203


##########
docs/en/setup/backend/backend-mysql-monitoring.md:
##########
@@ -1,21 +1,34 @@
 # MySQL monitoring
-SkyWalking leverages prometheus/mysqld_exporter for collecting metrics data from MySQL. It leverages OpenTelemetry Collector to transfer the metrics to
+SkyWalking leverages prometheus/mysqld_exporter for collecting metrics data. It leverages OpenTelemetry Collector to transfer the metrics to
 [OpenTelemetry receiver](opentelemetry-receiver.md) and into the [Meter System](./../../concepts-and-designs/meter.md).
+SkyWalking also leverages fluentbit(or other log collector) for collecting slow sql statement from MySQL.
 
 ## Data flow
+- `prometheus/mysqld_exporter`

Review Comment:
   ```suggestion
   - MySQL server performance from `prometheus/mysqld_exporter`
   ```


##########
docs/en/setup/backend/backend-mysql-monitoring.md:
##########
@@ -1,21 +1,34 @@
 # MySQL monitoring
-SkyWalking leverages prometheus/mysqld_exporter for collecting metrics data from MySQL. It leverages OpenTelemetry Collector to transfer the metrics to
+SkyWalking leverages prometheus/mysqld_exporter for collecting metrics data. It leverages OpenTelemetry Collector to transfer the metrics to
 [OpenTelemetry receiver](opentelemetry-receiver.md) and into the [Meter System](./../../concepts-and-designs/meter.md).
+SkyWalking also leverages fluentbit(or other log collector) for collecting slow sql statement from MySQL.
 
 ## Data flow
+- `prometheus/mysqld_exporter`
 1. mysqld_exporter collect metrics data from MySQL.
 2. OpenTelemetry Collector fetches metrics from mysqld_exporter via Prometheus Receiver and pushes metrics to SkyWalking OAP Server via the OpenCensus gRPC Exporter or OpenTelemetry gRPC exporter.
 3. The SkyWalking OAP Server parses the expression with [MAL](../../concepts-and-designs/mal.md) to filter/calculate/aggregate and store the results.
 
+- `slowsql`

Review Comment:
   ```suggestion
   - Collect sampled slow SQLs
   ```


##########
docs/en/setup/backend/backend-mysql-monitoring.md:
##########
@@ -1,21 +1,34 @@
 # MySQL monitoring
-SkyWalking leverages prometheus/mysqld_exporter for collecting metrics data from MySQL. It leverages OpenTelemetry Collector to transfer the metrics to
+SkyWalking leverages prometheus/mysqld_exporter for collecting metrics data. It leverages OpenTelemetry Collector to transfer the metrics to
 [OpenTelemetry receiver](opentelemetry-receiver.md) and into the [Meter System](./../../concepts-and-designs/meter.md).
+SkyWalking also leverages fluentbit(or other log collector) for collecting slow sql statement from MySQL.

Review Comment:
   ```suggestion
   SkyWalking also leverages fluentbit(or other log collector) for collecting slow sql statements from MySQL.
   ```


-- 
This is an automated message from the Apache Git Service.
To respond to the message, please log on to GitHub and use the
URL above to go to the specific comment.

To unsubscribe, e-mail: notifications-unsubscribe@skywalking.apache.org

For queries about this service, please contact Infrastructure at:
users@infra.apache.org


[GitHub] [skywalking] yswdqz commented on pull request #9614: Support monitoring MySQL slow sql

Posted by GitBox <gi...@apache.org>.
yswdqz commented on PR #9614:
URL: https://github.com/apache/skywalking/pull/9614#issuecomment-1249138558


   > I reworded the docs to make things more clear. In the docs, we should use colloquial sentences, instead, formal words are better.
   
   Thank you. I understand. I will do it better next time.


-- 
This is an automated message from the Apache Git Service.
To respond to the message, please log on to GitHub and use the
URL above to go to the specific comment.

To unsubscribe, e-mail: notifications-unsubscribe@skywalking.apache.org

For queries about this service, please contact Infrastructure at:
users@infra.apache.org


[GitHub] [skywalking] wu-sheng commented on a diff in pull request #9614: Support monitoring MySQL slow sql

Posted by GitBox <gi...@apache.org>.
wu-sheng commented on code in PR #9614:
URL: https://github.com/apache/skywalking/pull/9614#discussion_r972706877


##########
docs/en/setup/backend/backend-mysql-monitoring.md:
##########
@@ -1,5 +1,5 @@
-# MySQL monitoring
-SkyWalking leverages prometheus/mysqld_exporter for collecting metrics data from MySQL. It leverages OpenTelemetry Collector to transfer the metrics to
+# MySQL server performance from `prometheus/mysqld_exporter`

Review Comment:
   Don't change level one in the docs 


##########
docs/en/setup/backend/backend-mysql-monitoring.md:
##########
@@ -1,5 +1,5 @@
-# MySQL monitoring
-SkyWalking leverages prometheus/mysqld_exporter for collecting metrics data from MySQL. It leverages OpenTelemetry Collector to transfer the metrics to
+# MySQL server performance from `prometheus/mysqld_exporter`

Review Comment:
   Add a level two menu for this please 


-- 
This is an automated message from the Apache Git Service.
To respond to the message, please log on to GitHub and use the
URL above to go to the specific comment.

To unsubscribe, e-mail: notifications-unsubscribe@skywalking.apache.org

For queries about this service, please contact Infrastructure at:
users@infra.apache.org