You are viewing a plain text version of this content. The canonical link for it is here.
Posted to issues@trafficserver.apache.org by GitBox <gi...@apache.org> on 2021/02/22 20:38:14 UTC
[GitHub] [trafficserver] bryancall opened a new issue #7546: LogObject::_checkout_write using a lot of CPU on many core servers
bryancall opened a new issue #7546:
URL: https://github.com/apache/trafficserver/issues/7546


   When running benchmarking on large AMD servers (128 core servers) I am seeing a large amount of CPU being used in `LogObject::_checkout_write`.  Here are the results from the benchmark:

   https://github.com/bryancall/benchmark/blob/main/reports/amd_epic_7742_rhel7_aocc_rpms_no-freelist_jemalloc_openss111/http2_benchmark.report


----------------------------------------------------------------
This is an automated message from the Apache Git Service.
To respond to the message, please log on to GitHub and use the
URL above to go to the specific comment.

For queries about this service, please contact Infrastructure at:
users@infra.apache.org
[GitHub] [trafficserver] ywkaras commented on issue #7546: LogObject::_checkout_write using a lot of CPU on many core servers
Posted by GitBox <gi...@apache.org>.
ywkaras commented on issue #7546:
URL: https://github.com/apache/trafficserver/issues/7546#issuecomment-786257592


   When I ran the benchmark on a 64-CPU Intex Xeon, I did not see this problem.  It seems it is AMD dependent, or perhaps configuration dependent.


----------------------------------------------------------------
This is an automated message from the Apache Git Service.
To respond to the message, please log on to GitHub and use the
URL above to go to the specific comment.

For queries about this service, please contact Infrastructure at:
users@infra.apache.org
[GitHub] [trafficserver] ywkaras closed issue #7546: LogObject::_checkout_write using a lot of CPU on many core servers
Posted by GitBox <gi...@apache.org>.
ywkaras closed issue #7546:
URL: https://github.com/apache/trafficserver/issues/7546


--
This is an automated message from the Apache Git Service.
To respond to the message, please log on to GitHub and use the
URL above to go to the specific comment.

For queries about this service, please contact Infrastructure at:
users@infra.apache.org
[GitHub] [trafficserver] ywkaras removed a comment on issue #7546: LogObject::_checkout_write using a lot of CPU on many core servers
Posted by GitBox <gi...@apache.org>.
ywkaras removed a comment on issue #7546:
URL: https://github.com/apache/trafficserver/issues/7546#issuecomment-784490419


   Any record of the configuration that cased this problem?


----------------------------------------------------------------
This is an automated message from the Apache Git Service.
To respond to the message, please log on to GitHub and use the
URL above to go to the specific comment.

For queries about this service, please contact Infrastructure at:
users@infra.apache.org
[GitHub] [trafficserver] bryancall edited a comment on issue #7546: LogObject::_checkout_write using a lot of CPU on many core servers
Posted by GitBox <gi...@apache.org>.
bryancall edited a comment on issue #7546:
URL: https://github.com/apache/trafficserver/issues/7546#issuecomment-786356094


   Here is output from the package using the gcc compiler.  This is using the http/2 benchmark.  It isn't as bad as AOCC, but still it is an expensive operation:

   ```
   **http2load**
   finished in 120.34s, 24928.55 req/s, 390.48MB/s
   requests: 3000000 total, 3000000 started, 3000000 done, 3000000 succeeded, 0 failed, 0 errored, 0 timeout
   status codes: 3000000 2xx, 0 3xx, 0 4xx, 0 5xx
   traffic: 45.89GB (49274125891) total, 39.21MB (41119867) headers (space savings 96.56%), 45.78GB (49152000000) data
                        min         max         mean         sd        +/- sd
   time for request:      297us    629.51ms      8.01ms      8.71ms    88.32%
   time for connect:    33.66ms     91.14ms     53.87ms     14.13ms    55.50%
   time to 1st byte:    35.44ms    123.39ms     69.10ms     16.27ms    63.50%
   req/s           :     121.07      183.79      140.32       22.49    72.00%

   **dstat**
   You did not select any stats, using -cdngy by default.
   ESC[7l----total-cpu-usage---- -dsk/total- ---net/lo-- -net/total- ---paging-- ---system--
   usr sys idl wai hiq siq| read  writ| recv  send: recv  send|  in   out | int   csw
     1   0  99   0   0   0|2614B  211k|   0     0 :   0     0 |   0     0 |  28k   84k
    44  34  22   0   0   0|3123B 1209k| 338M  338M:  11M  640k|   0     0 |1045k  443k
    46  34  20   0   0   0|   0    11M| 355M  355M:  11M  727k|   0     0 |1073k  440k
    46  34  20   0   0   0|   0    54M| 347M  347M:  11M  589k|   0     0 |1069k  419k
    45  35  19   0   0   0| 819B  688k| 386M  386M:  11M 1408k|   0     0 |1089k  509k
    48  32  19   0   0   0|   0  5896k| 368M  368M:  11M 1487k|   0     0 |1084k  499k
    43  37  20   0   0   1|   0    55M| 378M  378M:  11M 1542k|   0     0 |1096k  494k
    45  36  19   1   0   1|2048B   57M| 384M  384M:  11M 1689k|   0     0 |1095k  512k
    46  34  19   0   0   0|   0  4642k| 385M  385M:  11M 1547k|   0     0 |1089k  518k
    33  38  28   0   0   1|   0  4176k| 465M  465M:  11M 1877k|   0     0 |1001k  652k
    22  36  41   0   0   1|3686B   47M| 503M  503M:  11M 2015k|   0     0 | 858k  666k
    22  34  41   2   0   1|3277B   47M| 439M  439M:  11M 1637k|   0     0 |1122k  561k
    22  26  50   1   0   1|2867B   47M| 554M  554M:  11M 1814k|   0     0 | 806k  692k
   **perf stat**

    Performance counter stats for process id '17983':

        10,466,445.26 msec task-clock                #   86.920 CPUs utilized
           28,088,848      context-switches          #    0.003 M/sec
            1,237,496      cpu-migrations            #    0.118 K/sec
              567,537      page-faults               #    0.054 K/sec
   33,958,594,177,446      cycles                    #    3.245 GHz                      (66.69%)
      977,798,939,842      stalled-cycles-frontend   #    2.88% frontend cycles idle     (66.68%)
      675,897,082,577      stalled-cycles-backend    #    1.99% backend cycles idle      (66.69%)
    4,346,448,211,697      instructions              #    0.13  insn per cycle
                                                     #    0.22  stalled cycles per insn  (66.68%)
      916,758,375,688      branches                  #   87.590 M/sec                    (66.68%)
       27,001,398,959      branch-misses             #    2.95% of all branches          (66.70%)

        120.414481542 seconds time elapsed

   **perf report**
   # Total Lost Samples: 0
   #
   # Samples: 48M of event 'cycles'
   # Event count (approx.): 36487625633965
   #
   #   Overhead  Shared Object         Symbol
   # ..........  ....................  ..................................................
   #
         39.17%  [kernel.kallsyms]     [k] native_queued_spin_lock_slowpath
         31.72%  traffic_server        [.] LogObject::_checkout_write
          1.79%  libpthread-2.17.so    [.] pthread_mutex_trylock
          1.67%  libjemalloc.so.2      [.] je_malloc_mutex_lock_slow
          0.54%  [kernel.kallsyms]     [k] copy_user_generic_string
          0.46%  [kernel.kallsyms]     [k] acpi_processor_ffh_cstate_enter
          0.43%  libc-2.17.so          [.] __memcpy_ssse3
          0.41%  [kernel.kallsyms]     [k] try_to_wake_up
          0.38%  [kernel.kallsyms]     [k] native_write_msr_safe
   ```


----------------------------------------------------------------
This is an automated message from the Apache Git Service.
To respond to the message, please log on to GitHub and use the
URL above to go to the specific comment.

For queries about this service, please contact Infrastructure at:
users@infra.apache.org
[GitHub] [trafficserver] bryancall commented on issue #7546: LogObject::_checkout_write using a lot of CPU on many core servers
Posted by GitBox <gi...@apache.org>.
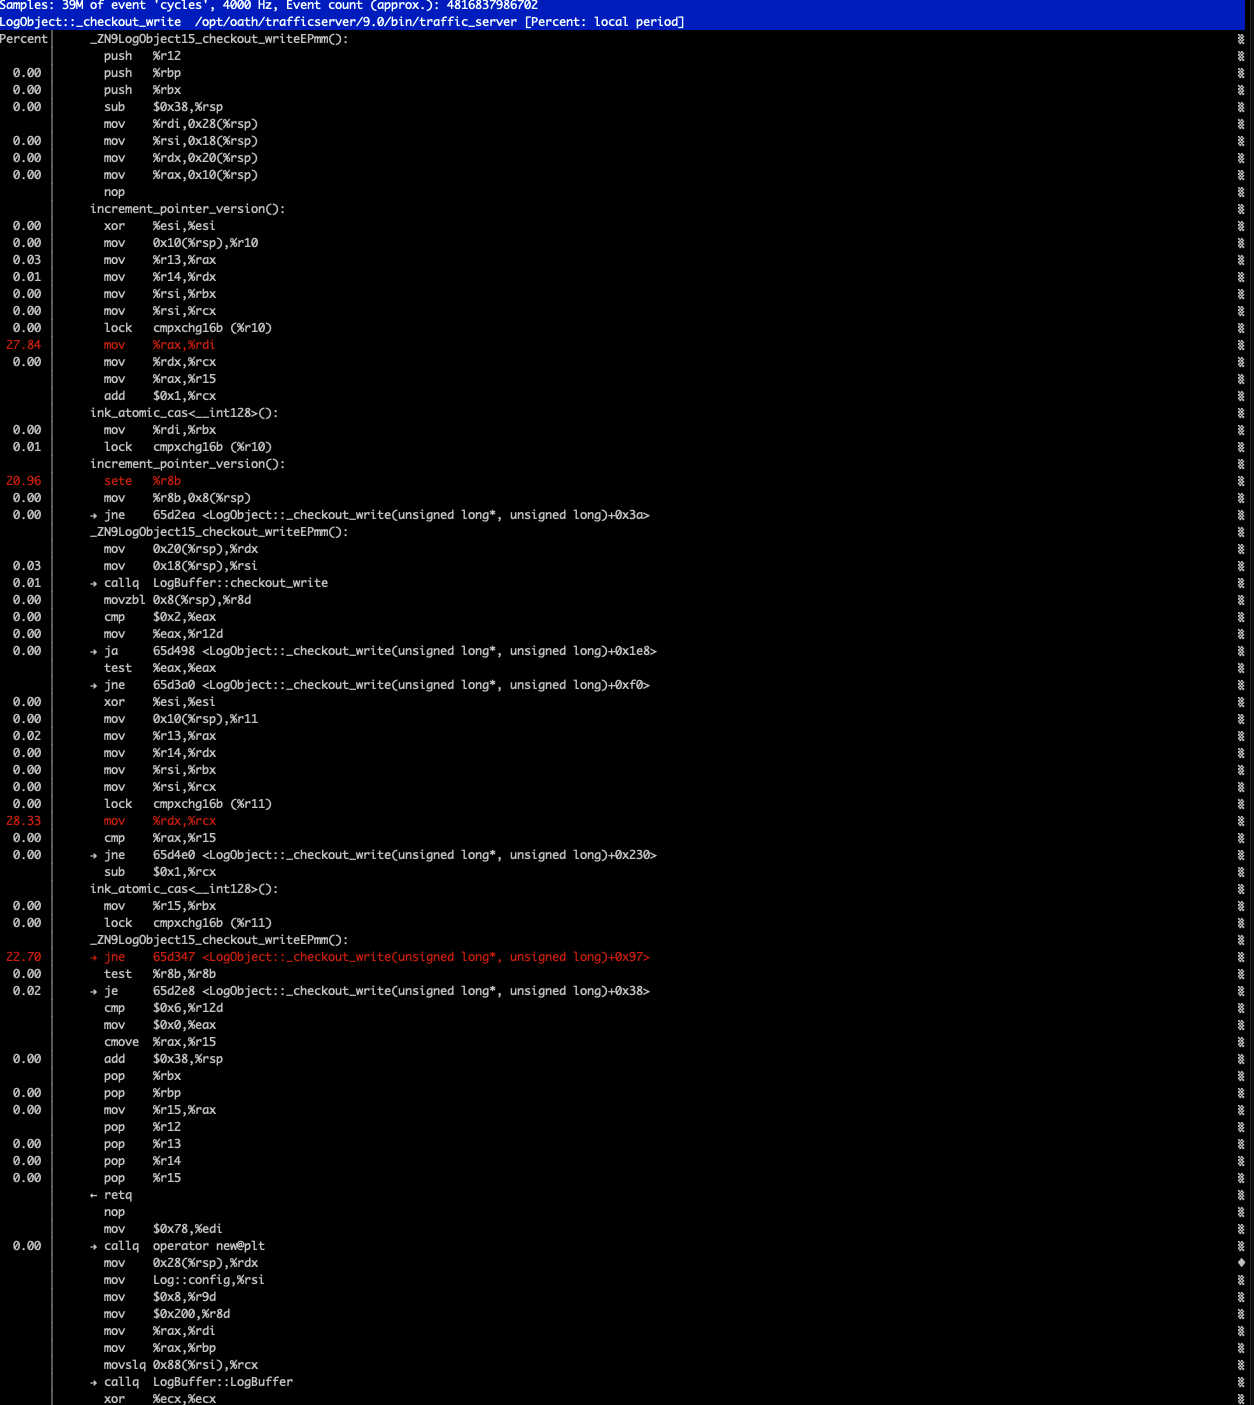
bryancall commented on issue #7546:
URL: https://github.com/apache/trafficserver/issues/7546#issuecomment-786358062
Here is the annotation of the _checkout_write method:
----------------------------------------------------------------
This is an automated message from the Apache Git Service.
To respond to the message, please log on to GitHub and use the
URL above to go to the specific comment.
For queries about this service, please contact Infrastructure at:
users@infra.apache.org
[GitHub] [trafficserver] ywkaras commented on issue #7546: LogObject::_checkout_write using a lot of CPU on many core servers
Posted by GitBox <gi...@apache.org>.
ywkaras commented on issue #7546:
URL: https://github.com/apache/trafficserver/issues/7546#issuecomment-786971941


   I've not been able to reproduce the problem on the AMD proxy.  There are my results:
   ```
   -bash-4.2$ cat http2_benchmark.report
   **http2load**
   finished in 10.17s, 98320.46 req/s, 1.50GB/s
   requests: 1000000 total, 1000000 started, 1000000 done, 1000000 succeeded, 0 failed, 0 errored, 0 timeout
   status codes: 1000000 2xx, 0 3xx, 0 4xx, 0 5xx
   traffic: 15.29GB (16419037931) total, 7.66MB (8031931) headers (space savings 96.63%), 15.26GB (16384000000) data
                        min         max         mean         sd        +/- sd
   time for request:      111us    130.27ms      1.51ms      4.90ms    92.15%
   time for connect:     3.38ms     87.15ms     38.33ms     20.31ms    69.00%
   time to 1st byte:     5.59ms    106.70ms     47.40ms     19.96ms    74.00%
   req/s           :     476.66      803.50      671.46       97.62    65.50%

   **dstat**
   You did not select any stats, using -cdngy by default.
   ----total-cpu-usage---- -dsk/total- ---net/lo-- -net/total- ---paging-- ---system--
   usr sys idl wai hiq siq| read  writ| recv  send: recv  send|  in   out | int   csw
     1   0  99   0   0   0|2597B  211k|   0     0 :   0     0 |   0     0 |  28k   84k
    13   5  81   0   0   1|   0    19M|1590M 1590M:2169B 2064B|   0     0 | 340k  295k
   **perf stat**

    Performance counter stats for process id '52642':

           167,926.60 msec task-clock                #   16.268 CPUs utilized
              644,529      context-switches          #    0.004 M/sec
               16,677      cpu-migrations            #    0.099 K/sec
                7,170      page-faults               #    0.043 K/sec
      292,679,346,215      cycles                    #    1.743 GHz                      (67.12%)
       41,677,240,403      stalled-cycles-frontend   #   14.24% frontend cycles idle     (67.21%)
       22,998,344,897      stalled-cycles-backend    #    7.86% backend cycles idle      (67.20%)
      212,494,852,375      instructions              #    0.73  insn per cycle
                                                     #    0.20  stalled cycles per insn  (67.15%)
       38,284,614,744      branches                  #  227.984 M/sec                    (67.13%)
        1,354,399,053      branch-misses             #    3.54% of all branches          (67.09%)

         10.322305247 seconds time elapsed

   **perf report**
   # Total Lost Samples: 0
   #
   # Samples: 1M of event 'cycles'
   # Event count (approx.): 448142823289
   #
   #   Overhead  Shared Object         Symbol
   # ..........  ....................  ..................................................
   #
          7.17%  libcrypto.so.1.1      [.] _aesni_ctr32_ghash_6x
          5.81%  libc-2.17.so          [.] __memcpy_ssse3
          3.51%  [kernel.kallsyms]     [k] copy_user_generic_string
          2.65%  libtscore.so.10.0.0   [.] freelist_new
          1.94%  [kernel.kallsyms]     [k] acpi_processor_ffh_cstate_enter
          1.60%  libc-2.17.so          [.] __memcmp_sse4_1
          1.04%  libtscpputil.so.10.0  [.] memcmp
          0.91%  traffic_server        [.] HpackIndexingTable::lookup
          0.80%  [kernel.kallsyms]     [k] _raw_spin_lock_irqsave
   ...
   ```
   I'm seeing much lower req/s on the AMD than on the Intel Xeon.
   Xeon:
   ```
   Architecture:          x86_64
   CPU op-mode(s):        32-bit, 64-bit
   Byte Order:            Little Endian
   CPU(s):                64
   On-line CPU(s) list:   0-63
   Thread(s) per core:    2
   Core(s) per socket:    16
   Socket(s):             2
   NUMA node(s):          2
   Vendor ID:             GenuineIntel
   CPU family:            6
   Model:                 79
   Model name:            Intel(R) Xeon(R) CPU E5-2683 v4 @ 2.10GHz
   Stepping:              1
   CPU MHz:               1200.091
   CPU max MHz:           3000.0000
   CPU min MHz:           1200.0000
   BogoMIPS:              4199.63
   Virtualization:        VT-x
   L1d cache:             32K
   L1i cache:             32K
   L2 cache:              256K
   L3 cache:              40960K
   ```
   AMD:
   ```
   Architecture:          x86_64
   CPU op-mode(s):        32-bit, 64-bit
   Byte Order:            Little Endian
   CPU(s):                128
   On-line CPU(s) list:   0-127
   Thread(s) per core:    2
   Core(s) per socket:    64
   Socket(s):             1
   NUMA node(s):          1
   Vendor ID:             AuthenticAMD
   CPU family:            23
   Model:                 49
   Model name:            AMD EPYC 7742 64-Core Processor
   Stepping:              0
   CPU MHz:               2250.000
   CPU max MHz:           2250.0000
   CPU min MHz:           1500.0000
   BogoMIPS:              4491.55
   Virtualization:        AMD-V
   L1d cache:             32K
   L1i cache:             32K
   L2 cache:              512K
   L3 cache:              16384K
   ```


----------------------------------------------------------------
This is an automated message from the Apache Git Service.
To respond to the message, please log on to GitHub and use the
URL above to go to the specific comment.

For queries about this service, please contact Infrastructure at:
users@infra.apache.org
[GitHub] [trafficserver] ywkaras edited a comment on issue #7546: LogObject::_checkout_write using a lot of CPU on many core servers
Posted by GitBox <gi...@apache.org>.
ywkaras edited a comment on issue #7546:
URL: https://github.com/apache/trafficserver/issues/7546#issuecomment-786971941


   I've not been able to reproduce the problem on the AMD proxy.  These are my results:
   ```
   -bash-4.2$ cat http2_benchmark.report
   **http2load**
   finished in 10.17s, 98320.46 req/s, 1.50GB/s
   requests: 1000000 total, 1000000 started, 1000000 done, 1000000 succeeded, 0 failed, 0 errored, 0 timeout
   status codes: 1000000 2xx, 0 3xx, 0 4xx, 0 5xx
   traffic: 15.29GB (16419037931) total, 7.66MB (8031931) headers (space savings 96.63%), 15.26GB (16384000000) data
                        min         max         mean         sd        +/- sd
   time for request:      111us    130.27ms      1.51ms      4.90ms    92.15%
   time for connect:     3.38ms     87.15ms     38.33ms     20.31ms    69.00%
   time to 1st byte:     5.59ms    106.70ms     47.40ms     19.96ms    74.00%
   req/s           :     476.66      803.50      671.46       97.62    65.50%

   **dstat**
   You did not select any stats, using -cdngy by default.
   ----total-cpu-usage---- -dsk/total- ---net/lo-- -net/total- ---paging-- ---system--
   usr sys idl wai hiq siq| read  writ| recv  send: recv  send|  in   out | int   csw
     1   0  99   0   0   0|2597B  211k|   0     0 :   0     0 |   0     0 |  28k   84k
    13   5  81   0   0   1|   0    19M|1590M 1590M:2169B 2064B|   0     0 | 340k  295k
   **perf stat**

    Performance counter stats for process id '52642':

           167,926.60 msec task-clock                #   16.268 CPUs utilized
              644,529      context-switches          #    0.004 M/sec
               16,677      cpu-migrations            #    0.099 K/sec
                7,170      page-faults               #    0.043 K/sec
      292,679,346,215      cycles                    #    1.743 GHz                      (67.12%)
       41,677,240,403      stalled-cycles-frontend   #   14.24% frontend cycles idle     (67.21%)
       22,998,344,897      stalled-cycles-backend    #    7.86% backend cycles idle      (67.20%)
      212,494,852,375      instructions              #    0.73  insn per cycle
                                                     #    0.20  stalled cycles per insn  (67.15%)
       38,284,614,744      branches                  #  227.984 M/sec                    (67.13%)
        1,354,399,053      branch-misses             #    3.54% of all branches          (67.09%)

         10.322305247 seconds time elapsed

   **perf report**
   # Total Lost Samples: 0
   #
   # Samples: 1M of event 'cycles'
   # Event count (approx.): 448142823289
   #
   #   Overhead  Shared Object         Symbol
   # ..........  ....................  ..................................................
   #
          7.17%  libcrypto.so.1.1      [.] _aesni_ctr32_ghash_6x
          5.81%  libc-2.17.so          [.] __memcpy_ssse3
          3.51%  [kernel.kallsyms]     [k] copy_user_generic_string
          2.65%  libtscore.so.10.0.0   [.] freelist_new
          1.94%  [kernel.kallsyms]     [k] acpi_processor_ffh_cstate_enter
          1.60%  libc-2.17.so          [.] __memcmp_sse4_1
          1.04%  libtscpputil.so.10.0  [.] memcmp
          0.91%  traffic_server        [.] HpackIndexingTable::lookup
          0.80%  [kernel.kallsyms]     [k] _raw_spin_lock_irqsave
   ...
   ```
   I'm seeing much lower req/s on the AMD than on the Intel Xeon.
   Xeon:
   ```
   Architecture:          x86_64
   CPU op-mode(s):        32-bit, 64-bit
   Byte Order:            Little Endian
   CPU(s):                64
   On-line CPU(s) list:   0-63
   Thread(s) per core:    2
   Core(s) per socket:    16
   Socket(s):             2
   NUMA node(s):          2
   Vendor ID:             GenuineIntel
   CPU family:            6
   Model:                 79
   Model name:            Intel(R) Xeon(R) CPU E5-2683 v4 @ 2.10GHz
   Stepping:              1
   CPU MHz:               1200.091
   CPU max MHz:           3000.0000
   CPU min MHz:           1200.0000
   BogoMIPS:              4199.63
   Virtualization:        VT-x
   L1d cache:             32K
   L1i cache:             32K
   L2 cache:              256K
   L3 cache:              40960K
   ```
   AMD:
   ```
   Architecture:          x86_64
   CPU op-mode(s):        32-bit, 64-bit
   Byte Order:            Little Endian
   CPU(s):                128
   On-line CPU(s) list:   0-127
   Thread(s) per core:    2
   Core(s) per socket:    64
   Socket(s):             1
   NUMA node(s):          1
   Vendor ID:             AuthenticAMD
   CPU family:            23
   Model:                 49
   Model name:            AMD EPYC 7742 64-Core Processor
   Stepping:              0
   CPU MHz:               2250.000
   CPU max MHz:           2250.0000
   CPU min MHz:           1500.0000
   BogoMIPS:              4491.55
   Virtualization:        AMD-V
   L1d cache:             32K
   L1i cache:             32K
   L2 cache:              512K
   L3 cache:              16384K
   ```


----------------------------------------------------------------
This is an automated message from the Apache Git Service.
To respond to the message, please log on to GitHub and use the
URL above to go to the specific comment.

For queries about this service, please contact Infrastructure at:
users@infra.apache.org
[GitHub] [trafficserver] ywkaras commented on issue #7546: LogObject::_checkout_write using a lot of CPU on many core servers
Posted by GitBox <gi...@apache.org>.
ywkaras commented on issue #7546:
URL: https://github.com/apache/trafficserver/issues/7546#issuecomment-783835929


   Outside chance that https://github.com/apache/trafficserver/pull/7382 would fix this.


----------------------------------------------------------------
This is an automated message from the Apache Git Service.
To respond to the message, please log on to GitHub and use the
URL above to go to the specific comment.

For queries about this service, please contact Infrastructure at:
users@infra.apache.org
[GitHub] [trafficserver] ywkaras commented on issue #7546: LogObject::_checkout_write using a lot of CPU on many core servers
Posted by GitBox <gi...@apache.org>.
ywkaras commented on issue #7546:
URL: https://github.com/apache/trafficserver/issues/7546#issuecomment-784490419


   Any record of the configuration that cased this problem?


----------------------------------------------------------------
This is an automated message from the Apache Git Service.
To respond to the message, please log on to GitHub and use the
URL above to go to the specific comment.

For queries about this service, please contact Infrastructure at:
users@infra.apache.org
[GitHub] [trafficserver] ywkaras commented on issue #7546: LogObject::_checkout_write using a lot of CPU on many core servers
Posted by GitBox <gi...@apache.org>.
ywkaras commented on issue #7546:
URL: https://github.com/apache/trafficserver/issues/7546#issuecomment-790235752


   I've been able to cause a bottleneck in LogObject::_checkout_write() on the AMD host, using open source TS (commit 5c65bcb4d0739cbadd09fab3d836110d529d48d2).  I had to set proxy.config.exec_thread.autoconfig.scale to 2.0 .  I ran TS (without manager) with this command:
   ```
   TS_ROOT=$PWD LD_LIBRARY_PATH=$PWD/lib bin/traffic_server -f -F &
   ```
   To see the bottleneck, I have to start with a empty log directory.  I have to run 10 h2load processes at once with this script:
   ```
   do_h2()
   {
   /home/wkaras/h2load --h1 -t 64 -D 60 -c 512 http://localhost:80$1/fake > ~/80$1.log &
   }

   rm -f ~/80*.log

   for P in $( seq 81 90 )
   do
     do_h2 $P
   done
   ```
   "fake" is 1024 byte object that I create with a PUSH.  When I run "perf top", I see about 95% of CPU time being spent in _checkout_write.  But, the bottleneck gradually disappears, the % of CPU time drops (as squid.log gets full?).

   For unknown reasons, I sometimes see the (disappearing) bottleneck in HttpTransact::OriginDead() instead of LogObject::_checkout_write().


----------------------------------------------------------------
This is an automated message from the Apache Git Service.
To respond to the message, please log on to GitHub and use the
URL above to go to the specific comment.

For queries about this service, please contact Infrastructure at:
users@infra.apache.org
[GitHub] [trafficserver] bryancall commented on issue #7546: LogObject::_checkout_write using a lot of CPU on many core servers
Posted by GitBox <gi...@apache.org>.
bryancall commented on issue #7546:
URL: https://github.com/apache/trafficserver/issues/7546#issuecomment-786356094


   Here is output from the package using the gcc compiler - it isn't as bad as AOCC, but still it is the most expensive operation by far:

   ```
   **http2load**
   finished in 32.31s, 92838.15 req/s, 1.44GB/s
   requests: 3000000 total, 3000000 started, 3000000 done, 3000000 succeeded, 0 failed, 0 errored, 0 timeout
   status codes: 3000000 2xx, 0 3xx, 0 4xx, 0 5xx
   traffic: 46.49GB (49917000000) total, 583.65MB (612000000) headers (space savings 0.00%), 45.78GB (49152000000) data
                        min         max         mean         sd        +/- sd
   time for request:      178us    864.37ms      1.88ms      6.56ms    95.16%
   time for connect:      179us     60.27ms     30.83ms     24.62ms    32.00%
   time to 1st byte:     7.67ms    252.08ms     93.93ms     50.69ms    68.00%
   req/s           :     469.10      651.57      573.43       54.94    64.50%

   **dstat**
   You did not select any stats, using -cdngy by default.
   ESC[7l----total-cpu-usage---- -dsk/total- ---net/lo-- -net/total- ---paging-- ---system--
   usr sys idl wai hiq siq| read  writ| recv  send: recv  send|  in   out | int   csw
     1   0  99   0   0   0|2531B  210k|   0     0 :   0     0 |   0     0 |  28k   84k
    56   6  38   0   0   1|   0   726k|1590M 1590M:  11M  903k|   0     0 |1097k  307k
    56   7  36   0   0   1|  43k   24M|1657M 1657M:  11M  779k|   0     0 | 960k  303k
    41   6  53   0   0   1|  56k 1315k|1548M 1548M:  11M 1048k|   0     0 | 767k  270k
   **perf stat**

    Performance counter stats for process id '7940':

         2,090,891.52 msec task-clock                #   52.006 CPUs utilized
            1,812,158      context-switches          #    0.867 K/sec
              173,492      cpu-migrations            #    0.083 K/sec
            2,323,668      page-faults               #    0.001 M/sec
    6,216,710,543,871      cycles                    #    2.973 GHz                      (66.78%)
      673,283,513,494      stalled-cycles-frontend   #   10.83% frontend cycles idle     (66.79%)
      305,534,719,417      stalled-cycles-backend    #    4.91% backend cycles idle      (66.81%)
    2,089,728,448,270      instructions              #    0.34  insn per cycle
                                                     #    0.32  stalled cycles per insn  (66.80%)
      452,605,506,651      branches                  #  216.465 M/sec                    (66.81%)
       16,368,538,783      branch-misses             #    3.62% of all branches          (66.81%)

         40.205123665 seconds time elapsed

   **perf report**
   # Total Lost Samples: 0
   #
   # Samples: 11M of event 'cycles'
   # Event count (approx.): 7027789530465
   #
   #   Overhead  Shared Object         Symbol
   # ..........  ....................  ..................................................
   #
         12.97%  traffic_server        [.] LogObject::_checkout_write
          4.54%  [kernel.kallsyms]     [k] native_queued_spin_lock_slowpath
          3.92%  traffic_server        [.] TSHttpTxnReenable
          3.13%  libtscore.so.9.0.1    [.] malloc_new
          3.08%  libtscore.so.9.0.1    [.] malloc_free
          2.87%  traffic_server        [.] HttpSM::state_api_callout
          2.69%  libtscore.so.9.0.1    [.] ink_freelist_new
          2.63%  traffic_server        [.] HttpHookState::getNext
          2.59%  libtscore.so.9.0.1    [.] ink_freelist_free
   ```


----------------------------------------------------------------
This is an automated message from the Apache Git Service.
To respond to the message, please log on to GitHub and use the
URL above to go to the specific comment.

For queries about this service, please contact Infrastructure at:
users@infra.apache.org
[GitHub] [trafficserver] zwoop commented on issue #7546: LogObject::_checkout_write using a lot of CPU on many core servers
Posted by GitBox <gi...@apache.org>.
zwoop commented on issue #7546:
URL: https://github.com/apache/trafficserver/issues/7546#issuecomment-783663137


   Curious if (significantly) increasing proxy.config.log.log_buffer_size would help here ?


----------------------------------------------------------------
This is an automated message from the Apache Git Service.
To respond to the message, please log on to GitHub and use the
URL above to go to the specific comment.

For queries about this service, please contact Infrastructure at:
users@infra.apache.org
[GitHub] [trafficserver] ywkaras edited a comment on issue #7546: LogObject::_checkout_write using a lot of CPU on many core servers
Posted by GitBox <gi...@apache.org>.
ywkaras edited a comment on issue #7546:
URL: https://github.com/apache/trafficserver/issues/7546#issuecomment-785425829


   One thing I'm seeing is that, when one thread is blocked waiting on this memory allocation:  https://github.com/apache/trafficserver/blob/564663b9b6888c8334ec8077b5583da9b192c3c2/proxy/logging/LogObject.cc#L399 , any other  thread trying to reserve (checkout) buffer space from the same LogObject will keep getting the return value LB_RETRY from LogBuffer::writer_checkout(), and will thus busy wait.  So we could be indirectly seeing the memory allocation blocking problem.  If this is the case, it would likely help to execute a thread yield when the LB_RETRY return value is returned.

   I think I need to reproduce the problem with a baseline build, then see if this change improves things.


----------------------------------------------------------------
This is an automated message from the Apache Git Service.
To respond to the message, please log on to GitHub and use the
URL above to go to the specific comment.

For queries about this service, please contact Infrastructure at:
users@infra.apache.org
[GitHub] [trafficserver] ywkaras commented on issue #7546: LogObject::_checkout_write using a lot of CPU on many core servers
Posted by GitBox <gi...@apache.org>.
ywkaras commented on issue #7546:
URL: https://github.com/apache/trafficserver/issues/7546#issuecomment-790835517


   I build this commit, https://github.com/ywkaras/trafficserver/commit/cd61f97667d9f90ca9ea8bf93e455be089ac086a , and re-ran the testing above.  Total requests per second almost doubled when the yield was enabled.


----------------------------------------------------------------
This is an automated message from the Apache Git Service.
To respond to the message, please log on to GitHub and use the
URL above to go to the specific comment.

For queries about this service, please contact Infrastructure at:
users@infra.apache.org
[GitHub] [trafficserver] ywkaras commented on issue #7546: LogObject::_checkout_write using a lot of CPU on many core servers
Posted by GitBox <gi...@apache.org>.
ywkaras commented on issue #7546:
URL: https://github.com/apache/trafficserver/issues/7546#issuecomment-785425829


   One thing I'm seeing is that, when one thread is blocked waiting on this memory allocation:  https://github.com/apache/trafficserver/blob/564663b9b6888c8334ec8077b5583da9b192c3c2/proxy/logging/LogObject.cc#L399 , any other  thread trying to reserve (checkout) will keep getting the return value LB_RETRY from LogBuffer::writer_checkout(), and will thus busy wait.  So we could be indirectly seeing the memory allocation blocking problem.  If this is the case, it would likely help to execute a thread yield when the LB_RETRY return value is returned.

   I think I need to reproduce the problem with a baseline build, then see if this change improves things.


----------------------------------------------------------------
This is an automated message from the Apache Git Service.
To respond to the message, please log on to GitHub and use the
URL above to go to the specific comment.

For queries about this service, please contact Infrastructure at:
users@infra.apache.org
[GitHub] [trafficserver] bryancall edited a comment on issue #7546: LogObject::_checkout_write using a lot of CPU on many core servers
Posted by GitBox <gi...@apache.org>.
bryancall edited a comment on issue #7546:
URL: https://github.com/apache/trafficserver/issues/7546#issuecomment-786356094


   Here is output from the package using the gcc compiler - it isn't as bad as AOCC, but still it is an expensive operation:

   ```
   **http2load**
   finished in 120.34s, 24928.55 req/s, 390.48MB/s
   requests: 3000000 total, 3000000 started, 3000000 done, 3000000 succeeded, 0 failed, 0 errored, 0 timeout
   status codes: 3000000 2xx, 0 3xx, 0 4xx, 0 5xx
   traffic: 45.89GB (49274125891) total, 39.21MB (41119867) headers (space savings 96.56%), 45.78GB (49152000000) data
                        min         max         mean         sd        +/- sd
   time for request:      297us    629.51ms      8.01ms      8.71ms    88.32%
   time for connect:    33.66ms     91.14ms     53.87ms     14.13ms    55.50%
   time to 1st byte:    35.44ms    123.39ms     69.10ms     16.27ms    63.50%
   req/s           :     121.07      183.79      140.32       22.49    72.00%

   **dstat**
   You did not select any stats, using -cdngy by default.
   ESC[7l----total-cpu-usage---- -dsk/total- ---net/lo-- -net/total- ---paging-- ---system--
   usr sys idl wai hiq siq| read  writ| recv  send: recv  send|  in   out | int   csw
     1   0  99   0   0   0|2614B  211k|   0     0 :   0     0 |   0     0 |  28k   84k
    44  34  22   0   0   0|3123B 1209k| 338M  338M:  11M  640k|   0     0 |1045k  443k
    46  34  20   0   0   0|   0    11M| 355M  355M:  11M  727k|   0     0 |1073k  440k
    46  34  20   0   0   0|   0    54M| 347M  347M:  11M  589k|   0     0 |1069k  419k
    45  35  19   0   0   0| 819B  688k| 386M  386M:  11M 1408k|   0     0 |1089k  509k
    48  32  19   0   0   0|   0  5896k| 368M  368M:  11M 1487k|   0     0 |1084k  499k
    43  37  20   0   0   1|   0    55M| 378M  378M:  11M 1542k|   0     0 |1096k  494k
    45  36  19   1   0   1|2048B   57M| 384M  384M:  11M 1689k|   0     0 |1095k  512k
    46  34  19   0   0   0|   0  4642k| 385M  385M:  11M 1547k|   0     0 |1089k  518k
    33  38  28   0   0   1|   0  4176k| 465M  465M:  11M 1877k|   0     0 |1001k  652k
    22  36  41   0   0   1|3686B   47M| 503M  503M:  11M 2015k|   0     0 | 858k  666k
    22  34  41   2   0   1|3277B   47M| 439M  439M:  11M 1637k|   0     0 |1122k  561k
    22  26  50   1   0   1|2867B   47M| 554M  554M:  11M 1814k|   0     0 | 806k  692k
   **perf stat**

    Performance counter stats for process id '17983':

        10,466,445.26 msec task-clock                #   86.920 CPUs utilized
           28,088,848      context-switches          #    0.003 M/sec
            1,237,496      cpu-migrations            #    0.118 K/sec
              567,537      page-faults               #    0.054 K/sec
   33,958,594,177,446      cycles                    #    3.245 GHz                      (66.69%)
      977,798,939,842      stalled-cycles-frontend   #    2.88% frontend cycles idle     (66.68%)
      675,897,082,577      stalled-cycles-backend    #    1.99% backend cycles idle      (66.69%)
    4,346,448,211,697      instructions              #    0.13  insn per cycle
                                                     #    0.22  stalled cycles per insn  (66.68%)
      916,758,375,688      branches                  #   87.590 M/sec                    (66.68%)
       27,001,398,959      branch-misses             #    2.95% of all branches          (66.70%)

        120.414481542 seconds time elapsed

   **perf report**
   # Total Lost Samples: 0
   #
   # Samples: 48M of event 'cycles'
   # Event count (approx.): 36487625633965
   #
   #   Overhead  Shared Object         Symbol
   # ..........  ....................  ..................................................
   #
         39.17%  [kernel.kallsyms]     [k] native_queued_spin_lock_slowpath
         31.72%  traffic_server        [.] LogObject::_checkout_write
          1.79%  libpthread-2.17.so    [.] pthread_mutex_trylock
          1.67%  libjemalloc.so.2      [.] je_malloc_mutex_lock_slow
          0.54%  [kernel.kallsyms]     [k] copy_user_generic_string
          0.46%  [kernel.kallsyms]     [k] acpi_processor_ffh_cstate_enter
          0.43%  libc-2.17.so          [.] __memcpy_ssse3
          0.41%  [kernel.kallsyms]     [k] try_to_wake_up
          0.38%  [kernel.kallsyms]     [k] native_write_msr_safe
   ```


----------------------------------------------------------------
This is an automated message from the Apache Git Service.
To respond to the message, please log on to GitHub and use the
URL above to go to the specific comment.

For queries about this service, please contact Infrastructure at:
users@infra.apache.org