You are viewing a plain text version of this content. The canonical link for it is here.
Posted to dev@echarts.apache.org by GitBox <gi...@apache.org> on 2018/05/25 01:52:58 UTC
[GitHub] lxiaosky opened a new issue #8399: SVG模式使用markPoint显示异常
lxiaosky opened a new issue #8399: SVG模式使用markPoint显示异常
URL: https://github.com/apache/incubator-echarts/issues/8399
<!--
为了方便我们能够复现和修复 bug,请遵从下面的规范描述您的问题。
-->
### One-line summary [问题简述]
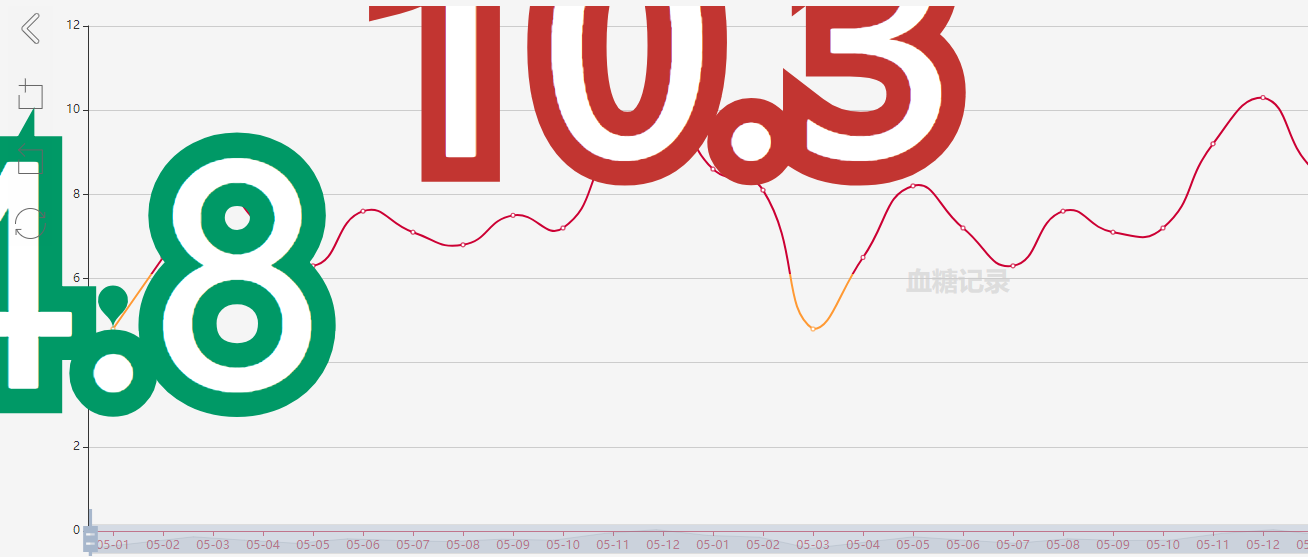
使用SVG模式使用markPoint显示异常,无法控制字体大小,显示的很大,在canvas模式下是正常的
### Version & Environment [版本及环境]
+ ECharts version [ECharts 版本]:
4.1.0.rc2 源代码版
+ Browser version [浏览器类型和版本]:
Google Chrome 版本 66.0.3359.181(正式版本) (64 位)
+ OS Version [操作系统类型和版本]:
windows10(64 位)
### Expected behaviour [期望结果]
能正常显示,并且能控制字体大小
### ECharts option [ECharts配置项]
<!-- Copy and paste your 'echarts option' here. -->
<!-- [下方贴你的option,注意不要删掉下方 ```javascript 和 尾部的 ``` 字样。最好是我们能够直接运行的 option。如何得到能运行的 option 参见上方的 guidelines for contributing] -->
```javascript
//echarts.init(document.getElementById('main'), null, {renderer: 'svg'}) 在SVG模式下会出现该问题,canvas正常
option = {
tooltip: {
trigger: 'none',
axisPointer: {
type: 'cross'
}
},
grid: {
left: 90,
right: 30,
top: 20,
bottom: 25
},
graphic: [
{
type: 'text',
left: 'center',
top: 'center',
z: -10,
style: {
fill: '#ddd',
text: '血糖记录',
font: 'bold 26px Microsoft YaHei'
}
}
],
visualMap: {
orient:'horizontal',
text: ['高', '低'],
top: 5,
right: 10,
pieces: [{
lt: 3.9,
color: '#096'
}, {
gt: 3.9,
lt: 6.1,
color: '#ff9933'
}, {
gt: 6.1,
color: '#cc0033'
}],
outOfRange: {
color: '#999'
}
},
toolbox: {
orient: 'vertical',
left: 10,
showTitle: false,
itemSize: 30,
itemGap: 30,
feature: {
myTool1: {
show: true,
title: 'back',
icon: 'path://M423.68 512l167.424 167.424a33.536 33.536 0 0 1-47.36 47.36l-187.648-187.648a33.536 33.536 0 0 1-9.728-27.136 33.536 33.536 0 0 1 9.728-27.136l187.648-187.648a33.536 33.536 0 1 1 47.36 47.36z',
onclick: function () {
api.closeWin()
api.setScreenOrientation({
orientation: 'portrait_up'
});
}
},
dataZoom: {
yAxisIndex: 'none',
icon: {
zoom: 'path://m17.5,57.4828l0,-13.9138m-6.6206,6.9828l23.3966,0l0,23.0172l-23.0172,0l0,-13.3966'
}
},
restore: {},
}
},
xAxis: {
type: 'category',
axisTick: {
alignWithLabel: true
},
axisLine: {
onZero: false,
lineStyle: {
color: '#d14a61'
}
},
axisPointer: {
label: {
margin: -50,
formatter: function (params) {
return params.value + ' 血糖值' + (params.seriesData.length ? ':' + params.seriesData[0].data + ' mmol/L' : '');
}
}
},
data: ["05-01", "05-02", "05-03", "05-04", "05-05", "05-06", "05-07", "05-08", "05-09", "05-10", "05-11", "05-12", "05-01", "05-02", "05-03", "05-04", "05-05", "05-06", "05-07", "05-08", "05-09", "05-10", "05-11", "05-12", "05-01", "05-02", "05-03", "05-04", "05-05", "05-06", "05-07", "05-08", "05-09", "05-10", "05-11", "05-12"]
},
yAxis: {
type: 'value',
},
dataZoom: [
{
type: 'slider',
start: 0,
end: 100,
bottom:2,
handleSize: '200%'
},
{
type: 'inside',
start: 0,
end: 100
}
],
series: {
name: '血糖值',
type: 'line',
smooth: true,
data: [4.8, 6.5, 8.2, 7.2, 6.3, 7.6, 7.1,6.8, 7.5, 7.2, 9.2, 10.3, 8.6, 8.1, 4.8, 6.5, 8.2, 7.2, 6.3, 7.6, 7.1, 7.2, 9.2, 10.3, 8.6, 8.1, 4.8, 6.5, 7.2, 6.3, 7.6, 7.1,6.8, 7.5, 7.2, 9.2],
markPoint: {
data: [
{type: 'max', name: '最大值'},
{type: 'min', name: '最小值', itemStyle: {color: '#096'}}
]
}
}
}
```
### Other comments [其他信息]
<!-- For example: Screenshot or Online demo -->
SVG模式
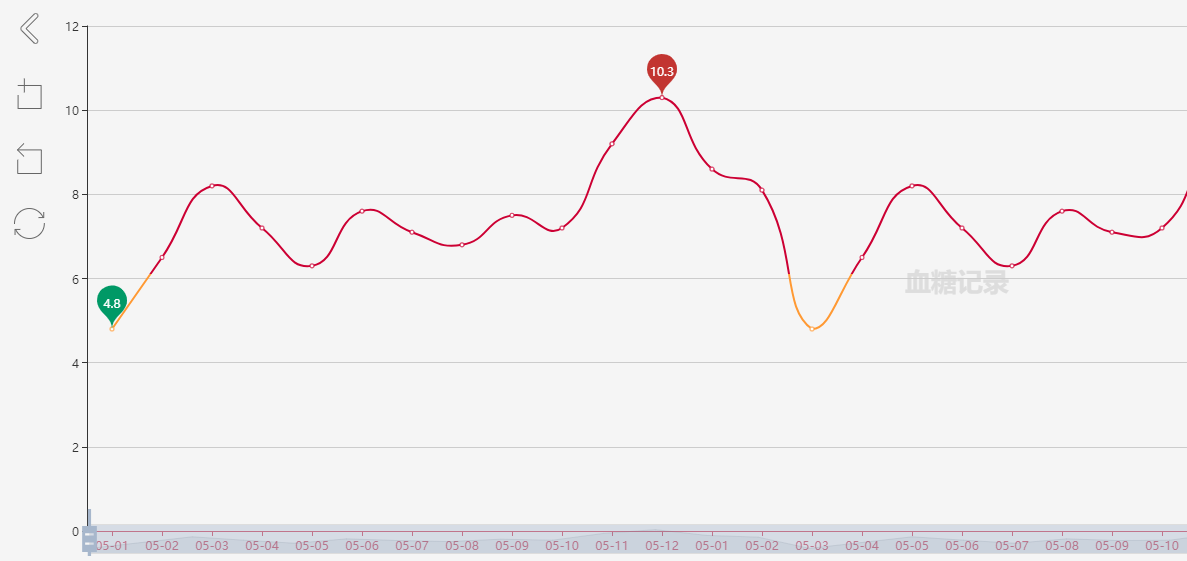
Canvas模式
<!-- [例如,截图或线上实例 (JSFiddle/JSBin/Codepen)] -->
----------------------------------------------------------------
This is an automated message from the Apache Git Service.
To respond to the message, please log on GitHub and use the
URL above to go to the specific comment.
For queries about this service, please contact Infrastructure at:
users@infra.apache.org
With regards,
Apache Git Services
---------------------------------------------------------------------
To unsubscribe, e-mail: dev-unsubscribe@echarts.apache.org
For additional commands, e-mail: dev-help@echarts.apache.org